Download
1 / 30
300 likes | 434 Vues
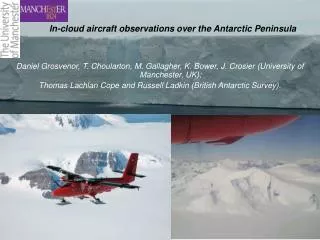
In-cloud aircraft observations over the Antarctic Peninsula. Daniel Grosvenor, T. Choularton, M. Gallagher, K. Bower, J. Crosier (University of Manchester, UK); Thomas Lachlan Cope and Russell Ladkin (British Antarctic Survey).

E N D
In-cloud aircraft observations over the Antarctic Peninsula Daniel Grosvenor, T. Choularton, M. Gallagher, K. Bower, J. Crosier (University of Manchester, UK); Thomas Lachlan Cope and Russell Ladkin (British Antarctic Survey). Daniel Grosvenor, Thomas Choularton, Martin Gallagher (University of Manchester, UK); Thomas Lachlan Cope and John King (British Antarctic Survey).
Contents • Antarctic clouds • Flight 102 – In situ observations of lenticular clouds • Ice number observations – can they give an estimate of Ice Nuclei concentrations? • How do they compare to current ice parameterisations (based on non-Antarctic clouds)? • Are Antarctic clouds different? • Flight 104 • Ice observations at colder temperatures • Ice formed by the Hallet Mossop process.
The CAPS instrument • Consists of 3 instruments • CAS (Cloud Aerosol Spectrometer) • Size distributions of particles 0.61-50 μm in diameter • CIP (Cloud Imaging Probe) • Takes images of particles 25-1550 μm in diameter (mainly ice) • Can calculate size distributions from these • Hotwire probe • Measures the liquid water content The BAS cloud instruments Knowing these is important as they determine cloud reflectivity • How do Antarctic clouds differ from mid-latitude ones? • Cloud Condensation Nuclei (CCN) concentrations? • Ice Nuclei (IN) concentrations? • Different CCN/IN sources – e.g. Bio IN?
The Antarctic Peninsula region Wilkins Larsen B 1750 km Larsen C 1540 km Scale comparison • Consists of a long ridge of high mountains (up to ~2000 m high). • Have 14 flights worth of cloud data = Rothera BAS base Topography
Case study – lenticular clouds in Marguerite bay Altitude (m) Approx wind direction • Deep low in the North Weddell Sea. • Led to a strong cross Peninsula flow (east to west). • Large stacks of lenticulars were developing over the mountains. • But flew through bands of lenticulars developing out into Marguerite Bay. • Clouds most likely formed on the crests of lee waves. = Rothera BAS base
Lee wave clouds Droplet formation Flow over mountain sets off vertical motions Droplet evaporation Aerosol (CCN/IN) processing through successive clouds? Stable air on downwind side allows vertical oscillations • Since such clouds are likely to have been recently formed and are not likely to be deep they are quite simple • May therefore be useful to look at ice nucleation
The overall picture Blue - indicates small particles, probably droplets Green – large particles, probably ice Grey - both. Approx wind direction
Flight segment20:20-20:40 UTC Blue - indicates small particles, probably droplets Green – large particles, probably ice Grey - both. Approx wind direction
Examining the lee waves • Gravity waves of temperature amplitude 2-5 oC. • Horizontal wavelengths of 9-10 km. • Predominately liquid formed at the crests of the gravity waves. • But some ice too • Ice present on the downward part of the waves – likely sedimentation from above • RHi > RH at these temperatures – so would be supersaturated w.r.t. ice if are forming liquid
3500 m 3000 m Blue - indicates small particles, probably droplets Green – large particles, probably ice Grey - both. 2500 m 2000 m 1500 m
Ice Nuclei concentration parameterisations Heterogeneous Ice Nuclei (IN) • These include deposition IN (direct nucleation from vapour phase) and condensation IN (liquid droplet nucleated first, which then freezes) • Numbers of up to ~0.15-0.35 per litre predicted for the temperature range of the lenticulars for the WRF scheme • Actual ice concentrations of 0.1-0.45 per litre observed. Thus IN parameterisation seem to be of the right magnitude.
Ice Nuclei concentration parameterisations Immersion and contact IN • Bigg’s (immersion IN) - IN already contained within droplets • Contact IN – when droplets collide with airborne IN and freeze • Gives a rate of freezing – need to estimate a period of nucleation to get a concentration
Estimation of ice duration of formation • Icy regions at gravity wave crests are ~5 km wide. • Wind speeds of ~20 m/s. Gives an ice forming time of ~250 s. • Gives an ice concentration of ~0.015-0.040 per litre for -11 to -14 oC. • For higher LWC of 0.2 g m-3 get 0.015-0.080 per litre. • Actual ice concentrations of 0.1-0.45 per litre observed. Thus immersion ice parameterisations are on the low side of the observed ice concentrations. • Heterogeneous IN likely slightly dominant over Biggs and contact freezing, according to parameterisations. • Overall, observed ice concentrations similar to predicted IN concentrations
3500 m 3000 m Blue - indicates small particles, probably droplets Green – large particles, probably ice Grey - both. 2500 m 2000 m 1500 m
Summary of another flight • Cold temperatures of cloud over the mountain. • Fairly low concentrations and large ice particles:- Ice mass (mg m-3) Ice number
Cold temperatures of cloud over the mountain. • Fairly low concentrations and large ice particles:- Ice mass (mg m-3) Ice number • Hallet Mossop splinter production zone • Plenty of liquid water available. • Lots of ice splinter columns observed:- Liquid water
Ice Nuclei parameterisation comparison • Heterogeneous IN parameterisations estimate ~2.25 L-1 at T= -20 oC • Biggs freezing (immersion IN) of up to ~0.02 L-1 s-1 predicted for T= -20 oC and LWC=0.3 g m-3. • Wind speeds of 18 m/s at T=-20 oC. Ice present over distances of ~25 km. • Gives estimate of ~>20 per litre at coldest temperatures. • Observed ice generally < 1 per litre • Suggests possible overestimation of parameterisations?
Conclusions • Lee wave (lenticular clouds) likely provide a good “natural laboratory” to look at Ice Nuclei numbers. • Mostly liquid formed in the gravity wave crests, but some ice was observed in the crests and in the troughs (where was likely precipitated from above). • Ice numbers were consistent with IN parameterisations for the -11 to -14 oC temperature range. • Parameterisations suggested that deposition/condensation IN likely the biggest source of ice. • Likely seeding of ice from aircraft exhaust – caution required in data interpretation and flight track planning. • For the colder clouds at -20 oC the parameterisation numbers were considerably higher than those observed (factor of 20 or so). • In the -3 to -8 oC temperature range the Hallet Mossop process was observed producing more ice particles – concentrations up to 3.5 per litre. • This process is likely to be important for glaciating Antarctic clouds given the likely low IN concentrations.