Download
1 / 32
320 likes | 394 Vues
Investigating downslope warming wind effects on Larsen Ice Shelf through modeling and aircraft observations. Analyzing mountain waves impact, possible causes, and influence on local warming trends. Researchers from University of Manchester and British Antarctic Survey.

E N D
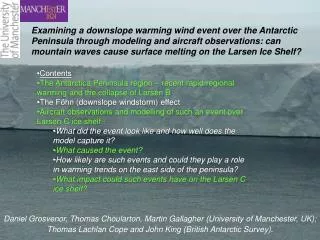
Examining a downslope warming wind event over the Antarctic Peninsula through modeling and aircraft observations: can mountain waves cause surface melting on the Larsen Ice Shelf? • Contents • The Antarctica Peninsula region – recent rapid regional warming and the collapse of Larsen B • The Föhn (downslope windstorm) effect • Aircraft observations and modelling of such an event over Larsen C ice shelf:- • What did the event look like and how well does the model capture it? • What caused the event? • How likely are such events and could they play a role in warming trends on the east side of the peninsula? • What impact could such events have on the Larsen C ice shelf? Daniel Grosvenor, Thomas Choularton, Martin Gallagher (University of Manchester, UK); Thomas Lachlan Cope and John King (British Antarctic Survey).
The Antarctic Peninsula region WARMER OCEANIC AIR Wilkins Larsen B 1750 km Larsen C COLD CONTINENTAL AIR 1540 km Scale comparison • Warmer oceanic air is generally deflected along the mountain barrier • Therefore, east side is usually under the influence of cold air from the continent • Annual mean temperatures on east are 5-10oC cooler than on the west at comparable latitudes • However, when westerlies impact on the peninsula in the right conditions the warmer air can cross the mountain barrier making east side warmer • Extra warming is also possible from adiabatic descent of air down the mountain slope and/or latent heat release – Föhn effect Topography
The Antarctic Peninsula warming trend • Peninsula has shown a major warming – Faraday station showed 0.56 oC per decade (1951-2000) compared with mean global warming of 0.6 oC in whole of 20th century. 1968-2000 • The warming in summer on the east side has been greater than for the west side Possible causes of amplified warming:- B • Southern Annular Mode (SAM) index has been increasing, especially in summer – leads to stronger westerlies • Linked to ozone loss (mainly) and greenhouse gases (less so) • May lead to more Föhn events. C 1970-2000 Warming trend oC per decade, 1965-2000, except where noted Marshall et al. (2006), Journal of Climate
The Föhn/downslope flow Warming of westerly flow can be enhanced by latent heat release on the upslope side and/or adiabatic descent of air from above, on the downslope side:- Wave breaking aloft allows air to descend on upslope of terrain and keep descending on downslope Type 2 Type 1 Some of the moisture precipitates out Moist air rising in saturated adiabat – gains heat from latent heat of condensation Dry adiabatic descent from aloft leads to warmer temperatures at the surface and gravitational acceleration produces strong winds. Possible dry adiabatic descent leading to warm temperatures at the surface • Strengthening of westerly winds due to increasing trend in summer SAM index could be causing increased frequencies of Föhn events and thus might account for the enhanced warming trend observed on the east side.
Collapse of the Larsen B ice shelf Wilkins Larsen C 31st Jan, 2002 MODIS satellite images Larsen B 175 km London Scale comparison 175 km
Collapse of the Larsen B ice shelf Wilkins Larsen C 17th Feb, 2002 MODIS satellite images Larsen B 175 km London 175 km
Collapse of the Larsen B ice shelf Wilkins Larsen C 23rd Feb, 2002 MODIS satellite images Larsen B 175 km London 175 km
Collapse of the Larsen B ice shelf Wilkins Larsen C 5th Mar, 2002 MODIS satellite images Larsen B 3200 km2 lost 175 km London Sediment data below the ice shelf suggests that it had been around for the last ~11,700 years. Evidence for glacier speed up – northern AP glaciers contribute ~0.16 mm/year to global sea levels
Collapse of the Larsen B ice shelf Wilkins Larsen C Larsen B 175 km London 175 km
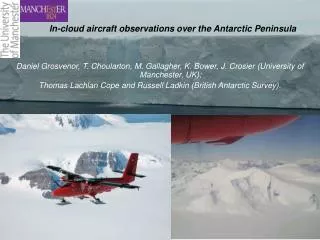
The 6th January, 2006 Föhn flow case • A British Antarctic Survey (BAS) flight over the Peninsula made observations in a Föhn flow • Modelled using a special polar version of WRF (Weather Research and Forecasting) mesoscale model • Initialised and boundaries driven by ECMWF 0.5 degree global model • 3 nests - 30, 7.5 and 1.875 km resolution
The synoptic situation Pressure (hPa) at 2.3 km from ECMWF analysis 6 UTC, 6th Jan Wind direction directed to the west where it rotates and impacts onto west side of the peninsula
Flight track and model results Aircraft observed jet windspeed maxima here 4th vertical model level; ~293 m above surface Wind speed (m/s) Rothera - BAS research station Colours are wind speed Arrows give wind speed and direction 18 UTC, 5th Jan
4th vertical model level; ~293 m above surface Wind speed (m/s)
4th vertical model level; ~293 m above surface Wind speed (m/s)
4th vertical model level; ~293 m above surface Wind speed (m/s)
4th vertical model level; ~293 m above surface Wind speed (m/s) 6 UTC, 6th Jan
4th vertical model level; ~293 m above surface Wind speed (m/s)
4th vertical model level; ~293 m above surface Wind speed (m/s)
Aircraft observed jet windspeed maxima here 4th vertical model level; ~293 m above surface Wind speed (m/s) 15 UTC, 6th Jan
4th vertical model level; ~293 m above surface Wind speed (m/s)
4th vertical model level; ~293 m above surface Wind speed (m/s) 21 UTC, 6th Jan
4th vertical model level; ~293 m above surface Wind speed (m/s)
4th vertical model level; ~293 m above surface Wind speed (m/s)
4th vertical model level; ~293 m above surface Wind speed (m/s)
4th vertical model level; ~293 m above surface Wind speed (m/s) 9 UTC, 7th Jan
15 UTC 6th January (model) Model profiles at location C • Generally a good match for wind direction, temperature and the jet height. • However, the timing is bad:- • Aircraft descent and ascent were at 20:40 and 22:01 UTC respectively. • After 15 UTC the model jets die down. • Modelled wind jets are too weak at 15 UTC. • Due to meteorology change – wind direction no longer perpendicular to mountain 3 km a) b) c) Ascent (22:01) Model Descent (20:40) 0 km 0 20 320 -15 5 0 Wind speed (m/s) Temperature (oC) Wind direction (degrees)
The changing synoptic situation that leads to the Föhn die down Föhn situation 6 UTC, 6th Jan Wind direction directed more to the west where it rotates and impacts onto west side of the peninsula
The changing synoptic situation that leads to the Föhn die down Non-Föhn situation 9 UTC, 7th Jan Wind direction coming from continent directed more along and to the east of the peninsula Low pressure system has moved east
Cross sections Wind direction Well-mixed region caused by wave breaking Approx. continuous stratification higher up Well mixed upstream region West East Blocked air below ~1 km Leads to strong downslope winds • Model predicts that a “type 2” Föhn event took place with severe blocking on the upwind side • Blocking may be necessary for downslope flow – does sea-ice play a role in the degree of blocking? • The past literature has often assumed that Föhn warming would not occur over the Antarctic Peninsula when the wind speed is low enough, or the stability high enough to produce upstream blocking. • Indicates likely importance of upper level winds and direction rather than speed for these events. 6 UTC, 6th Jan Potential temperature (K) Wind speed (m/s)
Melting of ice shelves over the 3 simulation days Total melting (mm water equivalent) Larsen B Larsen C • Production of melt water thought to have been the primary cause of the breakup of Larsen B through crevasse propagation. • Clear reduction in melting moving south down the peninsula ice shelves • Although northern sections of Larsen C experience similar melting to Larsen B • Most important energy source for melting is from the Sun rather than the warm Föhn air – but melting would not begin without the warm air above the ice surface (on/off switch)
Summary and conclusions Summer warming on the east side of the peninsula has been greater than that for the west and likely led to the collapse of the Larsen B ice shelf. Observations show that a Föhn event occurred on 6th January. Model reproduces the observed jet structure and direction well except for the duration/timing and wind speed under-prediction. This looks to be the result of large scale analysis problems (meteorology) Modelling suggests that a “type 2” Föhn event occurred - driven by mountain wave breaking and characterised by upstream blocking Warm air likely acts as an on/off switch for ice shelf surface melting rather than a significant energy source – most of the energy comes from the Sun Suggests Föhn events can occur at relatively low wind speeds in contrast to past literature for this region - may be more dependent on the stability and upper level wind direction – blocking looks to be a necessary condition –sea-ice, katabatic flow dependence?
Acknowledgements • I would like to thank Dave Bromwich and his team for supplying me with the polar WRF modifications. • I also thank ECMWF for the use of their high resolution analysis data. • And NCAS for the time provided on the HECTOR supercomputer.