The Paper Towel Absorbency Lab: Applying the Scientific Method
150 likes | 582 Vues
The Paper Towel Absorbency Lab: Applying the Scientific Method. Ms. Bormann 8 th Grade Honors Science Kawameeh Middle School. Applying the Scientific Method. 1. Ask a question . 2. Research the topic. 3. Form a hypothesis. Record the materials you are using

The Paper Towel Absorbency Lab: Applying the Scientific Method
E N D
Presentation Transcript
The Paper Towel Absorbency Lab:Applying the Scientific Method Ms. Bormann 8th Grade Honors Science Kawameeh Middle School
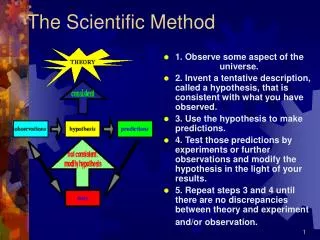
Applying the Scientific Method • 1. Ask a question. • 2. Research the topic. • 3. Form a hypothesis. • Record the materials you are using • 4. Test the Hypothesis. • 5. Gather Data. • 6. Analyze Results. • 7. Draw Conclusions. • 8. Communicate Results.
A little information before you ask a question and identify the purpose: In this experiment, we will use the scientific method to test three brands of paper towels to determine which brand really is ―the quicker picker upper. We will expose each brand of paper towel to the same treatment and then measure how much water each brand of towel absorbs in 30 seconds.
Question and Purpose • Which brand of paper towel will absorb the most water? Purpose • The purpose of this lab is to determine…
Research • You’ve been using paper towels to clean up your mess ever since you were a little kid. Identify some background information regarding the paper towel brands you will be using. • Sparkle Towels – www.sparkletowels.com • Kirkland Towels - http://www2.costco.com/Browse/Product.aspx?prodid=11942712&whse=BD_827&topnav=bd • Dollar General Towels - http://www.dollargeneral.com/family/index.jsp?categoryId=11666224
Hypothesis • This is a tentative answer to the problem or question being asked. • “If…then…” statement
Materials LIST all materials being used • Paper towels (be specific on brands) • 250 mL beaker • 1000 mL beaker • 100 mL graduated cylinder • Water • Stop watch
Experiment (test your hypothesis) • Cut and paste this procedure in your lab notebook. • When complete, below this procedure create a data table that includes towel brand, start amount (mL), finish amount (mL), and amount absorbed (mL).
Experiment (use your hypothesis) • Cut each paper towel sheet to the same size and RECORD the size in your notebook. • Fill your 1000 ml beaker with water. • Use the graduated cylinder to measure and fill the 250 ml beaker with 100 ml of water. • Fold each paper towel in half 4 times. • Dip one brand of paper towel in the water for 30 seconds. • After 30 seconds, remove the paper towel from the water and hold until no more water is dripping out of the paper towel. Do not shake the towel! Put the paper towel aside. • Pour the water remaining in the beaker back into the graduated cylinder and record the finish amount on the table you created. • Subtract the finish amount from the start amount to determine how much water each brand of paper towel absorbed. • Repeat for each brand of paper towel.
Experiment (test your hypothesis) • Combine the ―amount absorbed for your group with data collected in other groups in the table on the following page.
Analyze your data • Plot the average amount absorbed for each brand of towel on the graph provided. The independent variable is always on the X-axis (horizontal), while the dependent variable is always on the Y-axis (vertical). Label each axis with the variable and the unit of measure.
Analysis Questions • What can we conclude from the results of the experiment? • Do the results support your hypothesis? • Which variables were controlled in the experiment? (The control) • Why is repeating the experiment (replication) always important? • What are the potential sources of variability among groups? • What new questions do you have after completing this experiment? • How could you design an experiment to address your new questions?
Conclusion • Lets see what you remember about writing conclusions. Use any resources you have. Write a rough draft in your lab notebook for homework tonight. We will be peer editing the conclusion before your type your final draft!