Download

1 / 74
820 likes | 1.51k Vues
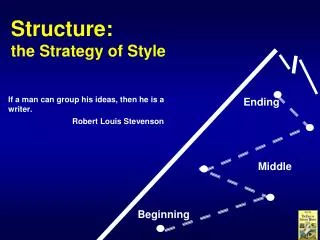
The Structure, Format, Content, and Style of a Journal-Style Scientific Paper. Chia-Hsiang Chen. Why a Scientific Format?. efficiently communicating scientific findings to the broad community of scientists in a uniform manner. allows the paper to be read at several different levels.

E N D
The Structure, Format, Content, and Style of a Journal-Style Scientific Paper Chia-Hsiang Chen
Why a Scientific Format? • efficiently communicating scientific findings to the broad community of scientists in a uniform manner. • allows the paper to be read at several different levels. • whatever level a person reads your paper (beyond title skimming), they will likely get the key results and conclusions.
Comments on scientific language • Publish or perish • Publish in English or perish
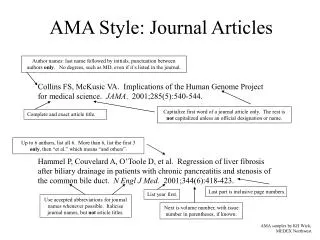
Title, Authors' Names, and Institutional Affiliations • The title should be centered at the top of page 1; the title is NOT underlined or italicized. • the authors' names (PI or primary author first) and institutional affiliation are double-spaced from and centered below the title.
Section Headings • Main Section Headings • Subheadings
ABSTRACT • An abstract summarizes, in one paragraph (usually), the major aspects of the entire paper in the following prescribed sequence: • the question(s) you investigated (or purpose), (from Introduction) • the experimental design and methods used, (from Methods) • the major findings including key quantitative results, or trends (from Results) • a brief summary of your interpetations and conclusions. (from Discussion)
INTRODUCTION • Establish the context of the work being reported. This is accomplished by discussing the relevantprimary research literature (with citations) and summarizing our current understanding of the problem you are investigating; • State the purpose of the work in the form of the hypothesis, question, or problem you investigated; and, • Briefly explain your rationale and approach and, whenever possible, the possible outcomes your study can reveal.
MATERIALS AND METHODS • the subjects used (plant, animal, human, etc.) and their pre-experiment handling and care, and when and where the study was carried out (if location and time are important factors); • if a field study, a description of the study site, including the physical and biological features, and precise location; • the experimental OR sampling design (i.e., how the experiment or study was structured. For example, controls, treatments, the variable(s) measured, how many samples were collected, replication, etc.); • the protocol for collecting data, i.e., how the experimental procedures were carried out, and, • how the data were analyzed (statistical procedures used).
Describe how the data were summarized and analyzed • how the data were summarized (Means, percent, etc) and how you are reporting measures of variability (SD,SEM, etc) • data transformation (e.g., to normalize or equalize variances) • statistical tests used with reference to the particular questions they address • any other numerical or graphicaltechniques used to analyze the data
RESULTS • Text • Tables • Figures
RESULTS • What are the "results"?: • Organize the results section based on the sequence of Table and Figures you'll include. • The body of the Results section is a text-based presentation of the key findings which includes references to each of the Tables and Figures. • Statistical test summaries (test name, p-value) are usually reported parenthetically in conjunction with the biological results they support. • Present the results of your experiment(s) in a sequence that will logically support (or provide evidence against) the hypothesis, or answer the question, stated in the Introduction.
Text • contrary to what you may have heard, not all analyses or results warrant a Table or Figure. Some simple results are best stated in a single sentence, with data summarized parenthetically:
How to refer to Tables and Figures from the text • Germination rates were significantly higher after 24 h in running water than in controls (Fig. 4). • DNA sequence homologies for the purple gene from the four congeners (Table 1) show high similarity, differing by at most 4 base pairs. • Table 1 shows the summary results for male and female heights at Bates College.
The "Acid Test" for Tables and Figures • it must be able to stand alone and be interpretable. • a clear and complete legend (sometimes called a caption) is essential.