Bridging Higher Education and Workforce Needs: Insights from Washington's Population Projections
800 likes | 908 Vues
This project, funded by the Ford Foundation, addresses the crucial connection between higher education and workforce demands in Washington state. Utilizing data from the U.S. Census Bureau, it highlights population changes, educational attainment gaps, and the diverse racial/ethnic composition of public high school graduates. The findings reveal disparities in college attainment and median earnings, underscoring the necessity for strategic educational policies to enhance access and equity. Stakeholders must engage collaboratively to meet the evolving needs of the workforce.

Bridging Higher Education and Workforce Needs: Insights from Washington's Population Projections
E N D
Presentation Transcript
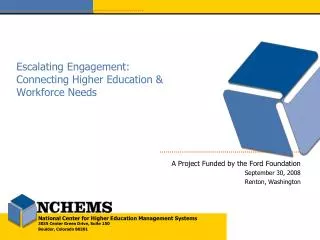
Escalating Engagement: Connecting Higher Education &Workforce Needs A Project Funded by the Ford Foundation September 30, 2008 Renton, Washington
93.3 85.8 -3.3 Population Projections—Percent Change, 2000-25 Source: U.S. Census Bureau
676,828 Projected Change in Washington Population byAge & Race/Ethnicity, 2005-25 (in Thousands) Source: U.S. Census Bureau
Racial/Ethnic Composition of Public High School Graduates in Washington 2014 - 15 2009 - 10 2004 - 05 American Indian/Alaska Native Asian/Pacific Islander Black non-Hispanic Hispanic White non-Hispanic Source: WICHE, Knocking at the College Door
Differences in College Attainment (Associate & Higher) Between Younger & Older Adults—U.S. & OECD Countries, 2006 Source: Organisation for Economic Co-operation and Development (OECD), Education at a Glance 2008
Differences in College Attainment (Associate & Higher) Between Younger & Older Adults—U.S., 2006 Source: U.S. Census Bureau, 2006 American Community Survey (ACS)
Percent of Adults with an Associate Degree or Higher by Age Group—Washington, U.S. & Leading OECD Countries Source: OECD, Education at a Glance 2008
Percent of Population Age 25-64 with an Associate Degree or Higher, 2006 Source: U.S. Census Bureau, 2006 ACS
Educational Attainment of Population Age 25-64, 2005 Source: U.S. Census Bureau, 2005 ACS Public Use Microdata Samples (PUMS)
Percent Educational Attainment of Population Age 25-64 By Race/Ethnicity—Washington, 2005 Source: U.S. Census Bureau, 2005 ACS PUMS
1 .6 to 5 .2 5 .2 to 8 .6 8 .6 to 11 .7 11 .7 to 38 .7 Percent of Population Age 25-64 with No High School Diploma, 2006—PUMAs Washington = 9.7% Source: U.S. Census Bureau, 2006 ACS
Percent of Population Age 25-64 with No High School Diploma, 2006 – High and Low PUMAs 1.6% 38.7% Source: U.S. Census Bureau, 2006 ACS
49 .1 to 77 .0 40 .3 to 49 .1 33 .9 to 40 .3 17 .1 to 33 .9 Percent of Population Age 25-64 with an Associate Degree or Higher, 2006—PUMAs Washington = 42.3% Source: U.S. Census Bureau, 2006 ACS
Percent of Population Age 25-64 with an Associate Degree or Higher, 2006 – High and Low PUMAs Source: U.S. Census Bureau, 2006 ACS
Vermont Difference in High School Attainment Between Whites and Minorities,* 2006 * Minorities include African-American, Hispanic, and Native American Source: U.S. Census Bureau, 2006 ACS PUMS
Vermont Difference in College Attainment Between Whites and Minorities,* 2006 * Minorities include African-American, Hispanic, and Native American Source: U.S. Census Bureau, 2006 ACS (PUMS)
U.S. Average Per Capita Personal Income as a Percent of U.S. Average - Washington, 1960-2005 Source: Regional Economic Information System, Bureau of Economic Analysis, U.S. Dept. of Commerce
32,124 to 51,721 25,810 to 32,124 23,033 to 25,810 15,020 to 23,033 Personal Income per Capita, 2006—PUMAs Washington = $27,346 Source: U.S. Census Bureau, 2006 ACS
Personal Income per Capita, 2006 – High and Low PUMAs $51,721 $15,020 Source: U.S. Census Bureau, 2006 ACS
Median Earnings of Population Age 25-64 by Level of Education, 2005 Source: U.S. Census Bureau, ACS
23,664 to 38,445 19,047 to 23,664 13,909 to 19,047 942 to 13,909 Difference in Median Earnings Between a High School Diploma and a Bachelor’s Degree, 2006 - PUMAs Washington = $19,696 Source: U.S. Census Bureau, 2006 ACS
Public High School Graduation Rate – Percent of 9th Graders Graduating Four Years Later by State (2006) Source: National Center for Education Statistics, Common Core Data
College-Going Rates—First-Time Freshmen Directly Out of High School as a Percent of Recent High School Graduates, 2004 Source: Tom Mortenson, Postsecondary Opportunity (2004 data update 02-06-07)
Washington Net Migration of First-time College Students by Sector (Fall 2006) Public 4 Year Private 4 Year For Profit Private 4 Year Non Profit Public 2 Year Private 2 Year For Profit Private 2 Year Non Profit Public Less than 2 Year Private Less than 2 Year For Profit Private Less than 2 Year Non Profit … -4415 Source: NCHEMS NCES IPEDS Enrollment Survey, Part C, Fall 2006
Top Out-of-State Institutions Washington Residents Attend, Fall 2006 FIRST-TIME INSTITUTION STATE FRESHMEN University of Idaho Idaho 309 Brigham Young University Utah 262 University of Phoenix-Online Campus Arizona 249 Apollo College-Portland Inc Oregon 240 University of Portland Oregon 198 Brigham Young University-Idaho Idaho 180 University of Oregon Oregon 157 American Intercontinental University Online Illinois 151 Arizona State University- Tempe Campus Arizona 132 Montana State University-Bozeman Montana 129 The University of Montana Montana 129 Western International University Arizona 128 Mt Hood Community College Oregon 128 Santa Clara University California 110 University of Arizona Arizona 103 Oregon State University Oregon 101 Linfield College Oregon 98 Willamette University Oregon 89 University of Southern California California 85 Wyoming Tech Wyoming 83 George Fox University Oregon 73 Portland State University Oregon 72 Boise State University Idaho 68 Central Texas College Texas 66 Portland Community College Oregon 65 Colorado Technical University Online Colorado 65 Northwest Nazarene University Idaho 63 North Idaho College Idaho 61 Stanford University California 60 Source: NCHEMS NCES IPEDS Enrollment Survey, Part C, Fall 2006
College Participation Rates by State for Students from Low-Income Families, 2006 Source: Postsecondary Education Opportunity #188, February 2008
New Hampshire Massachusetts South Carolina South Dakota United States Pennsylvania North Dakota West Virginia Rhode Island New Mexico Connecticut Washington New Jersey Minnesota Wisconsin Oklahoma New York Louisiana Nebraska California Delaware Arkansas Wyoming Kentucky Maryland Colorado Michigan Montana Vermont Missouri Nevada Arizona Kansas Virginia Oregon Indiana Florida Hawaii Alaska Illinois Maine Idaho Utah Iowa Ohio Texas Georgia Alabama Mississippi Tennessee North Carolina Change in College Participation Rates for Students from Low-Income Families by State, 1999-2006 Source: Postsecondary Education Opportunity #188, February 2008
Associate Degrees Awarded per 100 High School Graduates Three Years Earlier, 2004 Source: NCES-IPEDS Completions Survey, WICHE
Three-Year Graduation Rates at TwoYear Colleges, 2005 (Percent) Source: NCES, IPEDS Graduation Rate Survey
Bachelor’s Degrees Awarded per 100 High School Graduates Six Years Earlier, 2004 Source: NCES-IPEDS Completions Survey, WICHE
Six-Year Graduation Rates at FourYear Colleges, 2005 (Percent) Source: NCES, IPEDS Graduation Rate Survey
The Goal: Washington Reaching International Competitiveness by 2025 55% of Population Age 25-64 with College Degrees
Reaching Top Performance by 2025 (55%) – Washington 2,254,808 Number of Individuals to Match Best-Performing Countries (55%) 739,976 Number of Individuals (Age 25-44) Who Already Have Degrees 1,514,832 Additional Production Needed (2005 to 2025) 889,114 Degrees Produced at Current Annual Rate of Production 342,848 Additional Residents with College Degrees from Net Migration 282,870 Additional Degrees Needed 14,144 Additional Degrees Needed per Year (Currently Produce 47,803 in All Sectors) 33.8% Increase in Annual Associate and Bachelor’s Degree Production Needed (in Public Sector Only)
Collective Cost to Washington, AssumingTuition Stays the Same $388 Million = Annual Costs of Additional Students at Current $ per Student $1.5 Billion = Current State Contribution 26% = Percent Increase in Annual State Support Needed
Average Cost to Students, AssumingNo Additional State Investment $ 1,776 = Additional Annual Costs to Students at Public Four-Year Institutions 27% Increase in Tuition & Fees (Currently $6,538) $ 1,107 = Additional Annual Costs to Students at Public Two-Year Institutions 52% Increase in Tuition & Fees(Currently $2,114)
Educational Attainment in Washington (%) Current, in 2025 with Current Degree Production,and Best-Performing Countries in 2025
Pipeline Performance Is Cumulative How Can Washington Reach International Competitiveness? Current Degree Production Combined with Population Growth and Migration, and Improved Performance on Student Pipeline Measures Degrees Produced 2005-25 withCurrent Rate of Production Additional Degrees from Population Growth Additional Degrees from Net Migration of College-Educated Residents Reaching Best Performance in High School Graduation Rates by 2025 Reaching Best Performance in College-Going Rates by 2025 Reaching Best Performance in Rates of Degree Production per FTE Student Total Degrees Produced 2005-25 if All of the Above Degrees Needed to Meet Best Performance (55%) Source: 2005 ACS, PUMS
Savings if Washington Reaches Top Performance in Degree Production Reduced costs to Washington would be $285 million by improving efficiency of degree production to level of top states Performance: Undergraduate Degrees Awarded Per 100 Full-Time Equivalent Students (In $ Millions) 1,891 1,606
Percent of Civilian Population Age 25-64 Participating in the Workforce, 2005 Source: U.S. Bureau of Labor Statistics
Percent of Civilians Age 25-64 Not in the Workforce, 2006listed by Education Attainment Washington Unites States Source: U.S. Census Bureau, 2006 ACS PUMS
Less than High School High School Some College Associate Bachelor's Graduate/Professional Total Washington Net Migration of Residents Age 22-64 by Level of Education, 2005-06 Source: 2006 ACS (PUMS)
Percent of Residents Age 25-64 with an Associate Degree Born In-State, 2005 Source: 2005 ACS
Percent of Residents Age 25-64 with a Bachelor’s Degree or Higher Born In-State, 2005 Source: 2005 ACS
Percent of Total Gross State Product by Industry and Comparison to U.S. Source: Bureau of Labor Statistics
Percent Change in Gross State Product, 1997-2007 Source: Bureau of Economic Analysis, U.S. Department of Commerce
Change in Gross State Product, 1997-2004 Source: Bureau of Economic Analysis
Gross Domestic Product – Percent Change1997-2007 Washington United States …197.6 Source: Bureau of Economic Analysis, U.S. Department of Commerce
Development Report Card for the States, 2006 - Washington Washington Strengths(Top 10 Rankings) Washington Weaknesses(Bottom 10 Rankings) Source: 2006 Development Report Card for the States, CFED