Download
1 / 1
30 likes | 191 Vues
NATIONAL ATMOSPHERIC DEPOSITION PROGRAM. Concentrations and Deposition Total mercury concentration (ng/L)

E N D
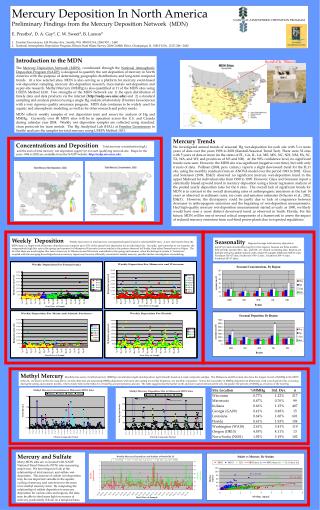
NATIONAL ATMOSPHERIC DEPOSITION PROGRAM Concentrations and Deposition Total mercury concentration (ng/L) and the sum of total mercury wet deposition (mg/m2/yr) for each qualifying network site. Maps for the years 1996 to 2002 are available from the NADP website: http://nadp.sws.uiuc.edu. Mercury Deposition In North America Preliminary Findings from the Mercury Deposition Network (MDN) E. Prestbo1, D. A. Gay2, C. W. Sweet2, B. Larson2 1. Frontier Geosciences, 414 Pontius Ave., Seattle, WA 98109 USA, (206) 957 – 1460 2. National Atmospheric Deposition Program, Illinois State Water Survey, 2204 Griffith Drive, Champaign, IL 61810 USA, (217) 244 - 0462 Introduction to the MDN The Mercury Deposition Network (MDN), coordinated through the National Atmospheric Deposition Program (NADP), is designed to quantify the wet deposition of mercury in North America with the purpose of determining geographic distributions and long-term temporal trends. At a few selected sites, MDN is also serving as a platform for mercury event-based wet-deposition sampling, mercury dry-deposition research, trace-metals wet-deposition and super-site research. Methyl Mercury (MMHg) is also quantified at 11 of the MDN sites using USEPA Method 1630. Two strengths of the MDN Network are: 1) the open distribution of timely data and data products via the internet (http://nadp.sws.uiuc.edu) and 2) a standard sampling and analysis protocol using a single Hg analytical laboratory (Frontier Geosciences) with a very rigorous quality assurance program. MDN data continues to be widely used for aquatic and atmospheric modeling, as well as for other research and policy needs. MDN collects weekly samples of wet deposition (rain and snow) for analysis of Hg and MMHg. Currently, over 80 MDN sites will be in operation across the U.S. and Canada during calendar year 2004. Weekly wet deposition samples are collected using standard, clean protocols for trace metals. The Hg Analytical Lab (HAL) at Frontier Geosciences in Seattle analyzes the samples for total mercury using USEPA Method 1631. Bondville, Illinois Mercury Trends We investigated annual trends of seasonal Hg wet-deposition for each site with 5 or more years of data over the years 1996 to 2002 (Kendall-Seasonal Trend Test). There were 32 sites with 5 years of data or more (in the states of FL, GA, IL, LA, ME, MN, NC, NH, NM, PA, SC, TX, WA, and WI; and provinces of NS and NB). At the 90% confidence level, no significant trends were seen. However, the ME96 site was significant (negative over time), but with only 4 years of data. Pollman (2004, pers. comm.) reports a slight downward trend for the FL11 site, using the monthly residuals from an ANOVA model over the period 1993 to 2002. Glass and Sorenson (1999, ES&T) observed no significant mercury wet-deposition trend in the upper Midwest for individual sites from 1990 to 1995. However, Glass and Sorenson report a statistically biased upward trend in mercury deposition using a linear regression analysis of the pooled yearly deposition rates for the 6 sites. The overall lack of significant trends for MDN is in contrast to the overall decreasing rates of anthropogenic emissions in the last 14 years as observed in sediment cores, ice-cores and emission estimates (Schuster et al., 2002, ES&T). However, the discrepancy could be partly due to lack of congruence between decreases in anthropogenic emissions and the beginning of wet-deposition measurements. Had high-quality mercury wet-deposition measurements started as early as 1990, we likely would have seen a more distinct downward trend as observed in South Florida. For the future, MDN will be one of several critical components of a framework to assess the impact of reduced mercury emissions from coal-fired power plants due to expected regulations. Weekly DepositionWeekly time series of total mercury wet deposited (ng/m2/year) for selected MDN sites. A new observation from the MDN data is a single week of mercury deposition can comprise up to 30% of the annual total deposition for an individual site. Secondly, and somewhat to our surprise, the comparatively high flux rate in the spring and summer for Minnesota-Wisconsin is more similar to the pattern observed in Florida, than either Pennsylvania or Maine. The fact that there are much higher flux rates of mercury to Minnesota and Wisconsin watersheds in the spring and summer, when the biological system is “turned-on”, coupled with the emerging knowledge that new mercury inputs may be more efficiently converted to methyl mercury, justifies further investigation via modeling. SeasonalityRegional average total mercury deposition (ng/m2/yr) and concentration (ng/L) for five regions. Seasons are three months time periods (winter=Dec., Jan., and Feb., etc.) based on starting date. Regions are defined with all available stations with at least 60 samples (Midwest MD=15 sites; Northeast NE=17 sites; Northwest NW= 2 sites; Southwest SW= 4 sites; Southeast SE=17 sites). Methyl MercuryMonthly time series of methyl mercury (MMHg) concentration (ng/l) and deposition, ng/m2/month based on 4-week composite samples. The Minnesota and Wisconsin sites have the longest record of MMHg in the MDN network. As shown on the site map above, several other sites are measuring MMHg deposition, with most sites opting for weekly frequency, not monthly composites. Notice the seasonality in MMHg deposition in Minnesota, with a much greater flux occurring during the spring and summer months, which closely follows the behavior of total Hg and precipitation amount. The table suggests that the farther north and more marine influenced the site, the greater the percent of MMHg as a fraction of the total Hg. Mercury and Sulfate Many MDN sites are co-located with NADP National Trend Network (NTN) sites measuring major ions. We have begun to look at the relationship of total mercury and sulfate wet-deposition. The amount of sulfate wet-deposition may be one important variable in the aquatic cycling of mercury and conversion to the more toxic methyl mercury form. By comparing the relationship of sulfate deposition to mercury deposition for various sites and regions, the data may be able to shed some light on sources of mercury, particularly if done on a temporal basis.