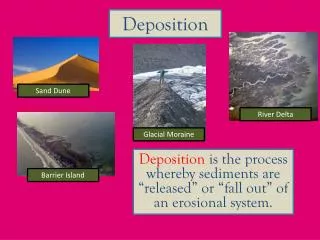
Mercury Deposition
Mercury Deposition. Wet and dry Deposition. Volatilization. Outflow. Hg (0). Inflow/Runoff. Reduction. Photodegradation. Oxidation. Hg (II). MeHg. Settling/Resusp Diffusion. Settling/Resusp Diffusion. Bioaccumulation. Hg (II). MeHg. Burial. Burial. Demethylation. Methylation.

Mercury Deposition
E N D
Presentation Transcript
Wet and dry Deposition Volatilization Outflow Hg(0) Inflow/Runoff Reduction Photodegradation Oxidation Hg(II) MeHg Settling/Resusp Diffusion Settling/Resusp Diffusion Bioaccumulation Hg(II) MeHg Burial Burial Demethylation Methylation Source: R. Harris, Tetra-Tech, Inc. Aquatic Mercury Cycling Model
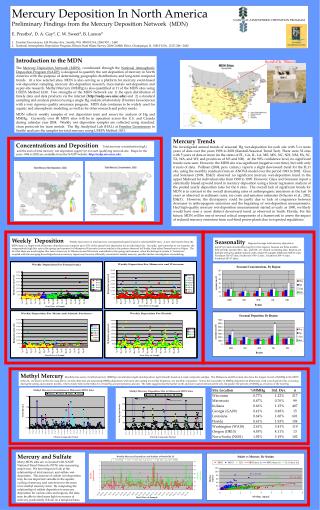
methylation methylation Mercury Exposure Pathway Lake Ocean Atmospheric deposition • Fishing • commercial • recreational • subsistence Humans and wildlife affected primarily by eating fish containing methylmercury • Effects • Best documented effects on the developing fetus: impaired motor and cognitive skills • Possibly other effects Wet and Dry Deposition Emissions From Power Plants and Other Sources Mercury transforms into methylmercuryin soils and water, then canbioaccumulate in fish Ecosystem Transport, Methylation, and Bioaccumulation Emissions and Speciation Atmospheric Transport and Deposition Consumption Patterns Health Effects 3
States with One or More Mercury Fish Advisorieshttp://epa.gov/waterscience/fish/advisories/ 1993 2003 899 advisories 2,362 advisories Source: “Mercury School”, OAQPS presentation for Metro4/SESARM, dated March 2, 2007
Mercury TMDLs: By Region 4 with States – Watersheds (done over several years) Mercury TMDLs Developed by Region 4 with States This map represents a compilation of TMDLs developed by EPA in conjunction with States over the past several years
National Emissions Inventory Tons Mercury Per Year, 1990-2002 Source: “Mercury School”, OAQPS presentation for Metro4/SESARM, dated March 2, 2007
50 45 ) s e e 40 r g e d ( e d 35 u t i t a L 30 25 -125 -120 -115 -110 -105 -100 -95 -90 -85 -80 -75 -70 -65 Longitude (degrees) Total-Mercury Emissions: 1999 ICR Power Plants Total Hg (tons per year) 0 to 0.025 0.025 to 0.05 0.05 to 0.1 0.1 to 0.5 0.5 to 1.1 NOTE: Excludes 1 plant in AK and 1 plant in HI Source: “Mercury School”, OAQPS presentation for Metro4/SESARM, dated March 2, 2007
Mercury Emissions and Biota Burdens – Is there a potential link? • In South Florida (Everglades and other areas) reduced Hg (Hg+2) emissions from incinerators & other sources • Expect lower MeHg in fish and wading birds • MeHg decline may have leveled off in most recent years • Recent lower MeHg levels vary somewhat from place to place • In New Hampshire (loons) and Massachussetts (fish) MeHg levels show declines (1997 – 2002) as upwind Hg emissions have declined • Declines in sulfate as well as in mercury emissions during the last decade or so may be related to lower MeHg levels in fish on Isle Royale in Lake Superior
National Emissions Inventory For Toxics
Enhancing the EPA Region 4 Toxics NEI • WHY are we doing this? • WHAT do we propose to do to enhance the database?
WHY are we doing this? • The air toxics NEI is critical to develop and assess the national air toxics management program as well as local exposure scenarios • Region 4’s NEI is currently compiled from voluntary information submitted by SLT air agencies and data developed in-house by EPA (e.g., TRI data) • Users need data which are reported consistently and accurately from place to place, and with consistent QA/QC protocols
Example – 2005 NEI CAP = Criteria Air Pollutant; HAP = Hazardous Air Pollutant
WHAT do we propose? • Form an EPA/State/Local/Tribal workgroup (December 2007) to investigate the status of the Regional Toxics NEI and to develop a strategy to enhance the NEI over time • What/when/how do SLTs currently report? • What are the most critical changes needed to increase consistency and quality of Region 4 submissions? • What is the suggested path forward to achieve these changes? • The workgroup will compile and submit recommendations by the end of FY08
Autobody Shop Initiative • Region 4 coordinating with OAQPS, EPA's Design for the Environment (DfE), and state/local partners to promote autobody shop best practices for reducing emissions, exposures, and cost • Workshops in Jackson, MS (November ’07), Norcross, GA (January ’08) • Develop a promotional DVD • Work with State/locals to develop a plan to disseminate best practices information • Autobody area source proposed rule: Published September 17, 2007; Final by December 15, 2007 • EPA Contact: Paul Wagner (404-562-9100; wagner.paul@epa.gov)
Clean Energy and Climate Change (EC2)
A Few of HQ’s Programs • Voluntary Partnerships • Energy Star • Clean Energy Programs • Climate Leaders • National Action Plan for Energy Efficiency • States & Municipalities • Communicating about climate change
Region 4’s Approach • Build knowledge within the Region 4 community • Support our State partners in their efforts • Collaborate with our Federal partners • Collaborate with and promote clean energy and greenhouse gas reductions with industry and other stakeholders
Some of our potential focus areas… • Collaborate on clean energy and climate change efforts • Energy efficiency (e.g., Energy Star), including in water management • Improved materials management (e.g., resource conservation, waste reduction, reuse, and recycling) • Alternative fuels • Green Buildings • Cleaner energy technologies and information transfer • Overcoming economic and regulatory barriers • EC2 Supplemental Environmental Projects (SEPs) • Promoting change at the level of the individual (behavioral change)
Region 4 Clean and Sustainable Energy Conference • December 11 and 12, 2007, in downtown Atlanta • Initiate dialogue on how to promote clean, affordable and sustainable energy options across Region 4 • Solicit feedback on whether, and in what form, ongoing discussion should develop to improve the Southeast's access to clean, sustainable energy sources http://www.trackg.com/R4CleanEnergy/