Download
1 / 46
460 likes | 643 Vues
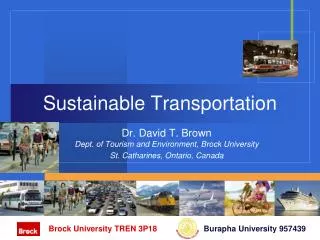
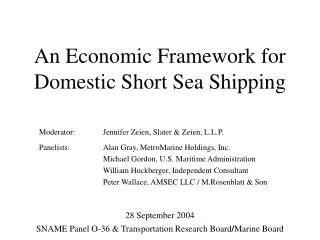
Sustainable Intermodal Transportation Network Using Short Sea Shipping. Young-Tae Chang & Hwa-Joong Kim. Graduate School of Logistics, Inha University, Korea APEC TPT38, July 2 nd , 2013, Bali, Indonesia . Sustainable Intermodal Transportation Network Using Short Sea Shipping. nd. 2 .

E N D
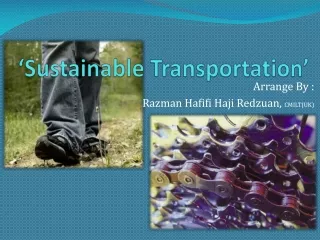
Sustainable Intermodal Transportation Network Using Short Sea Shipping Young-Tae Chang & Hwa-Joong Kim Graduate School of Logistics, Inha University, Korea APEC TPT38, July 2nd, 2013, Bali, Indonesia
Sustainable Intermodal Transportation Network Using Short Sea Shipping nd 2 Phase of Short Sea Shipping Study that Can Improve Intermodal Efficiency and Reduce Pollution, Congestion, Fuel Cost and Green House Gas Emission Transportation Working Group – Intermodal and ITS Expert Group (IIEG)
What does the project Seek toachieve ? Objective The objective of the project is to extend our previous study on Short Sea Shipping as suggested in its original proposal, which was funded by APEC Transportation Working Group in 2007 1 2 New Phase study aims Addressing the issue of the green house gas(GHG) emission Develop Intermodal transportation network model From transportation sources to respond to upcoming regulation on, international shipping by the IMO Enhance more seamless, efficient and effective interconnectivity among various modes surface transportation modes by the Kyoto protocol Reducing congestion, pollution, noise and other externalities Using this model, total transportation/ logistics cost in a given economy can be minimized and various policy options and practices are test and analyzed for the optimal policy formulation
Intermodal Transportation Network in Korea
Intermodal Transportation Network (Sample Network of Export) port Seattle China Quingdao South Korea port Seoul Japan Incheon Uiwaing port United ICD States Shanghai port Busan port Osaka Yokohama port port Long Beach port 7
Ports / Cities / ICDs The oversea ports (34) Korean seaports (5) Cities Countries Busan Ulsan Western Europe Amsterdam Gwangyang Pyeoungtak Eastern Europe Hamburg Incheon North America Vancouver United States Houston, Detroit Long Beach, New York Savannah, Seattle ICDs (2) South America Santos Uiwang Central Asia Jeddah Yangsan Singapore, Klang, Other seaports South East Asia Korean Regions (11) Durban Africa Osaka, Yamaguchi, Yokohama, Nagoya, Hakata, Tokyo Other seaports Japan Jeonnam Seoul Gyungbuk Busan Hong Kong Keelung, Kaosiung, Other seaports Gyunnam Incheon Gyunggi Chungbuk Ningbo, Shanghai, Qingdao, Xingang, Weihai, Yantai, Other seaports China Gangwon Chungnam Jeonbuk 8
$ ETS TAX Validation External cost Emission Trading Scheme Carbon Tax 9
Validation Model (Notations) Sets set of externalities set of seaports in Korea set of overseas ports set of ICDs set of transport modes: {1, 2, 3, 4} where 1 denote truck, 2 train, 3 barge, and 4 liner ship Coefficients set of regions internalization ratio of the external cost logistics cost of transport mode m from node i to j[US $/TEU] where TEU is a twenty foot equivalent unit import or export amount from origin i to destinationj[TEU] external cost of externality e of transport mode m [US $/TEU-km] CO2 emission limit [ton] CO2emissions from transport mode m [ton/TEU-km] freight rate per TEU of transport mode m from node i to j [US $/TEU] distance from node i to j [km] price of CO2 emission permits in the CO2 trading market [US $/ton] transit time of transport mode m from node i to j [day] Decision Variables tax on CO2 emissions[US $/ton] CO2 emissionsfrom all inland transport modeslower than the emission limit [ton] daily time cost of a container [US $/TEU] CO2 emissionsfrom all inland transport modeshigher than the emission limit [ton] index for Uiwang ICD total container movements by transport mode m [TEU-km] container volumetransported by transport mode m from node i to jamong trading volumes originating from adestined to b[TEU] index for Yangsan ICD 10
Validation Model (Objective Function) Minimize the sum of the freight rate and time cost of all containers transported via all transport modes and routes [P1] Minimize (1) subject to (2) (3) (4) (5) (6) (7) (8) (9) (10) (11) 11
$ External Cost Model
Model Structure Accident Congestion Willingness to Pay Method Internalizing External Cost Pollution Noise Analyzing the impact on Modal Shift 12
We assume that the government imposes a tax on the external cost (as the internalization ratio of the external cost) to carriers and carriers will pass the tax subsequently onto shippers in the form of surcharge External cost of externality e of transport mode m [US$/TEU-km] Distance from node i to j [km] Internalization ratio of the external cost 13
TAX Carbon Tax Model
The Carbon Tax can be incorporated into the model by including the tax into the logistics cost with the same assumption made in the external cost model CO2 emissions from transport mode m [ton/TEU-km] Distance from node i to j [km] Tax on CO2 emissions [US$/ton] 14
ETS Emission Trading Scheme Model
If the total amount of the emissions is more than the limit, the higher emitter should purchase extra permit from lower emitters who have the surplus CO2 emission permits in a trading market The purchased amount of CO2 emissions if TKm is the total container movement by mode m (12) (13) (14) 15
The purchased amount of CO2 emissions Extra incurring cost from purchasing CO2 emission permit Extra incurring revenue from selling CO2 emission permit < assumption > 16
Allocated cost and revenue are proportionally allocated to each container by considering its travel distance as follows and ** transport mode contrary to mode m in terms of CO2 emission Finally, the logistics cost per TEU in the emission trading scheme model is as follows 17
Data structure 3 transportation modes (truck, train, barge) for inland transportation, one mode (mainline ship) for sea shipping 2ICDs 34foreign seaports 5 domestic seaports 11 domestic region Year 2009 import and export container cargo data 18
Import amount/TEU Source: Statistical Yearbook of International Trade and Logistics published by Korea Customs Trade and Development Institute (KCTDI, 2010) and publically available web database of Korea Ministry of Land, Transport and Marine Affairs (http://www.spidc.go.kr:10443/). 19
Source: Statistical Yearbook of International Trade and Logistics published by Korea Customs Trade and Development Institute (KCTDI, 2010) and publically available web database of Korea Ministry of Land, Transport and Marine Affairs (http://www.spidc.go.kr:10443/). Export amount/TEU 20
Distance / km (a) Between ICD/Port and Region Source: website of Sea Rates (http://www.searates.com/) (b) Between ICD/Port and Port Source: website of Naver (http://map.naver.com/) 21
Transit Time and Freight Rate for Inland Mode The transit time between inland nodes was calculated using the distance divided by the speed of corresponding transport modes, i.e., Transit time : truck: 80 km/h, train: 50 km/h, and barge: 23.5 km/h loading/unloading time : truck: 3 h, train: 9 h, and barge: 6 h Lim (2004) Since train is not connected between all nodes, the connectivity between nodes for train is given in the below table * no direct connection * * directly connected 22
Transit Time(day) and Freight Rate (US$/TEU) for Inland Mode Source: website of Schedule Bank (http:// www.schedulebank.com/) 24
External Cost (US$/TEU-km) The external cost was calculated by multiplying 36.14 (ton/TEU), 1.2 (US $/EURO), and the external cost (EURO/ton-km) in Beutheet al. (2002). 25
Test results and Implications
Validation Comparison Between Validation Model’s Result and Real Modal Splits The model generates a similar transport modal split to the real modal split in Korea in 2009 obtained from the website of Korea Maritime Institute (http://www.kmi.re.kr) Therefore, the validation model is deemed to suffice to reflect the real situation in Korea and hence the extended models of respective external cost, carbon tax, andemission trading scheme can be further tested 26
Effect of Taxation of External Cost ( a / b ) / a * 100% 27
Effect of Carbon Tax Regulation ( a / b ) / a * 100% 28
Effect of Emission Trading Scheme Regulation (a) Actual CO2 price in recent years ( a / b ) / a * 100% 29
Effect of Emission Trading Scheme Regulation (b) High CO2 price ( a / b ) / a * 100% 30
Result of External Cost Model The train’s share sharply increases absorbing the share of truck and even barge. The barge increases in the share are not remarkable even though the share increases from current 1.8% to 4.9%when the internalization ratio is 0.2 then begins to decline graduallyto 1.1% when the tax is levied to reflect the whole external costs This may have been caused by the double size pollution effect of barges compared with train although the barge incurs no congestion, accidents, noise, and wear and tear 31
Result of External Cost Model The external costs incurred by all inland transport modes decrease sharply along with the internalization ratio’s increase. The initial reduction of external costs is remarkable, for instance with 10% internalization, the external costs are reduced by 23%. The reduction of the external costs increases gradually until 50% of internalization ratio then it appears to reach saturation point when internalization ratio is beyond 60%. Note that we did not change all possible links of trains and barge in the test in order to show the results under the current transportation network system. However, if all possible links of trains and barge have been connected, the total external costs would have been much more reduced than the result. 32
Result of the Carbon Tax and ETS Models We examined which regulation between a carbon tax and emission trading scheme is more effective to reduce CO2 emission ETS TAX Carbon Tax Model Emission Trading Scheme Model (Under the scenario of different tax) (Using the heuristic procedure under the scenario of different CO2 prices and emission limit factors) 33
Result of the Carbon Tax and ETS Models In case of the carbon tax model, the share of train increases significantly absorbing most of shares of truck and barge and the total CO2 emissions from all inland transport modes decline along with the increase of the carbon tax On the other hand, the change in the modal split and the total CO2 emissions under the emission trading scheme model with actual CO2 market prices in recent years is not significant even though the share of train increases slightly as the CO2 price increases and emission limit factor decreases 34
Result of the Carbon Tax and ETS Models This result implies that shippers’ modal and route choice may not be significantly affected from an emission trading scheme regulation although the Korean government enforces the regulation and moreover some revenue gained from selling CO2 emission permits is allocated to shippers in the form of freight rate reduction if current CO2 market prices are maintained Comparing the results of the carbon taxation and ETS, the emission trading scheme appears to be a less effective instrument than the carbon tax to reduce CO2 emissions in the transportation sector 35
Result of the Carbon Tax and ETS Models (under the condition of carbon prices is as high as the carbon tax) This is somewhat surprising result in contrast with those views supporting ETS(Council of the European Union, 2008) The result may have been caused by too low CO2 prices even though the price ranges are based on actual CO2 market prices in recent years There will be an argument that if the carbon prices were as high as the carbon tax , the results of the ETS would have been much different, so we test this argument using much higher carbon prices in the ETS model The result show that total CO2 emissions from all inland transportation modes declines significantly along with the increase of the CO2 price, while the modal shift is not significant 36
EU ETS carbon spot price(2008-2013) Source: Thompson Reuters Point Carbon
Policy Implication The transport policy should be directed toward the inclusion of the external costs into carriers’ pricing to reduce the externalities. Just a mere initial low percentage of taxation of the external costs would result in significant reductions of the externalities. The excessive taxation on the external cost, however, may not be a good policy instrument for more use of barge and advisable modal shift. Therefore, an optimal amount of tax should be explored looking into not only the reduction of external costs, but also the balance in modal split. Furthermore, the changes in modal split and external costs will be affected by extended linkage among the nodes and expansion of transportation structure along with the enhanced efficiency of the modes. 37
Policy Implication International organization and governments should devise some policy instruments to increase the CO2 price which is stagnant around several ten US$/ton in the current market The Korean government should develop a scheme of sharing the burden and benefit of the extra cost and revenue between transport modes arising from the ETS to balance the modal split 38
Limitation of study The limitation of this study is using parameters of the external costs from other studies Future study should conduct our own estimation of the external cost function 39
ytchang@inha.ac.kr It is the end of the slides