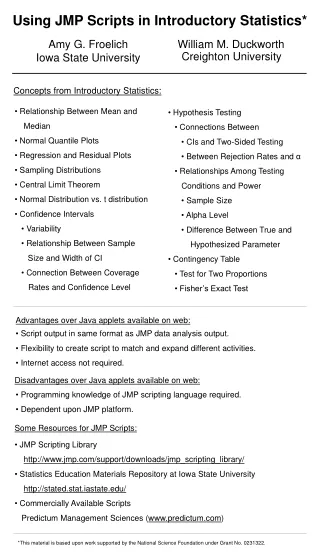
Download
1 / 20
200 likes | 347 Vues
Using Real vs Simulated Data in an Introductory Statistics Course. Christopher J. Malone Kansas State University. Lit Review. Caldwell (1983), “Combining Real and Generated Data in Lab Exercises to Demonstrate Problems in Inference”, Proceedings of the Section on Statistics Education

E N D
Using Real vs Simulated Data in an Introductory Statistics Course Christopher J. Malone Kansas State University Joint Statistical Meetings
Lit Review • Caldwell (1983), “Combining Real and Generated Data in Lab Exercises to Demonstrate Problems in Inference”, Proceedings of the Section on Statistics Education • “Limiting lab exercises to the analysis of real data is a analogous to practicing dart-throwing by concentrating on one’s form without being able to see how close each dart comes to the bullseye.” • Gives several examples of real/simulated data exercises Joint Statistical Meetings
Lit Review • Halley (1991), “Teaching Social Statistics with Simulated Data”. Teaching Sociology • Real data contains missing codes…leads to unnecessary confusion • …interesting and significant relationships often disappear when providing unique data sets with real data Joint Statistical Meetings
Real/Simulated • What does Real data bring to the classroom? • Self-motivating • Students can use preconceived judgments to “complete” an analysis (subjective analysis + analytical analysis) • Students get a feel for real problems inherent in real data • ?Obviously?, more realistic Joint Statistical Meetings
Real/Simulated • What does simulated (realistic) data bring to the classroom? • More easily provide individualized data sets • Easily investigate the purpose, concept, and behavior of a statistical procedure • Avoid many of the pre-analysis issues • Verify a statistical procedure • Time management issues Joint Statistical Meetings
Real/Simulated • Best Solution ??? Real + Simulated Joint Statistical Meetings
Existing Systems • Previous Work… • Gitlow & Oppenheim (1982), Stat City • Halley (1991), “Teaching Social Statistics with Simulated Data”. GENSTAT system • Chang et all (1992), “Teaching Survey Sampling Using Simulation”, SURVEY • Schwarz (1997), “StatVillage: An On-Line Hypothetical City Based on Real Data for Use in an Introductory Class in Survey Sampling” Joint Statistical Meetings
Existing Systems • Gitlow & Oppenheim (1982), Stat City • Objectives: 1. …complete statistical problems…totality of statistical studies, from inception through memorandum • unified statistical problems… • Used at the undergraduate and graduate levels • Wide variety of problems (ex. telephone bills, Tax Assessor’s Office, territorial shopping behavior) • Students’ response: “extremely enthusiastic “ Joint Statistical Meetings
Existing Systems • Halley (1991), “Teaching Social Statistics with Simulated Data”. GENSTAT system • Used to assist instructors in the creation of sample data for demonstration, homework, lab work, and testing • Very flexible (specify variables name, parameters, etc) • Emphasis placed on individualized data sets • Creates a file of data and provides a complete solution Joint Statistical Meetings
Existing Systems • Chang et all (1992), “Teaching Survey Sampling Using Simulation”, SURVEY • Used in introductory and advanced survey courses • Simulates samples drawn from a hypothetical county • Specific purpose, Cablevision Company • Costs, non-response issues are incorporated • Students’ response: “gave a feeling of realism to the class” Joint Statistical Meetings
Existing Systems • Schwarz (1997), “StatVillage: An On-Line Hypothetical City Based on Real Data for Use in an Introductory Class in Survey Sampling” • Two main selling points: 1. Accessibility (World Wide Web) 2. Based on actual census records • Multiple variables, single location (Vancouver BC) • Mention “easily modify”, not sure to what extent??? Joint Statistical Meetings
Existing Systems • Grades: • “Best” Solution ?? • Combine GENSTAT and StatVillage Joint Statistical Meetings
Examples • Personal Example #1 (GENSTAT) • Multiple linear regression ( indicators/ interaction/non-constant variance/outliers) • Modeling used car prices based on mileage, age, and domestic/foreign • Each group gets data from a variety of models • Parameter estimates are specified (by the instructor) so that students may start in the same spot, but may end in a very different spot • Might have to “sufficientize” the data for grading purposes Must communicate “important” issues that arise within groups across groups!! Joint Statistical Meetings
Examples • Personal Example #2 (StatVillage) • Selling prices of homes in local area over the past 3 years • Each group gets a particular “area” or a random sample from the entire database • Students visit the database once for simple linear regression and return for multiple linear regression (same observations used the second time for comparison purposes) Must communicate “important” issues that arise within groups across groups!! Joint Statistical Meetings
Examples • Personal Example #3 (StatVillage +, -Real) • Planet X • Students are asked to visit the planet to obtain data for all “missions” (projects) • Data are “different” than here on earth (wanted relationships to be unknown) • Students pose research questions, gather relevant variables, write briefings, missing values included,… • Side-effects (Good/Bad, you decide…) • Students never see real data • Prevents subjective analysis • Students results are not verified Must communicate “important” issues that arise within groups across groups!! Joint Statistical Meetings
Survey • Very Simple Survey • Students (Spring 2001 semester): • 87 respondents • second semester introductory business statistics • Faculty & GTAs (May 2001): • 9 respondents • Teach a variety of classes (undergraduate & graduate) Joint Statistical Meetings
Survey • Additional Questions (1=Low, 5=High) • A. How important is it for you to create your own question of interest? • B. How important is it to use real data? • C. How important is it to use realistic data? • D. How important is it that all students have the same data set? • E. How important is it that all students do the same analyses? • F. How important is individualism/ownership? Joint Statistical Meetings
Survey • Results -- Students Joint Statistical Meetings
Survey Students Faculty • Results -- Students/Faculty Joint Statistical Meetings
Future work… • Create a web-based interface so that students can easily get samples of real data or simulated data • Instructors provide the file (Excel, say) and samples are obtained through the web • Automate a procedure for verification of results • Problems with groups need to be communicated across groups – very important for learning! Joint Statistical Meetings