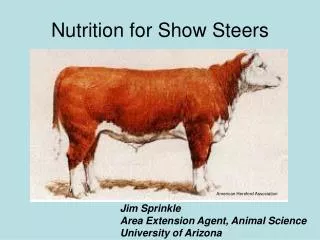
Nutrition for Show Steers
420 likes | 648 Vues
Nutrition for Show Steers. American Hereford Association. Jim Sprinkle Area Extension Agent, Animal Science University of Arizona. Growth Curve for Cattle. Bulls. Maturity. Steers. Growth Units. Heifer. Puberty. Castration. Window of Acceptability. For cattle

Nutrition for Show Steers
E N D
Presentation Transcript
Nutrition for Show Steers American Hereford Association Jim Sprinkle Area Extension Agent, Animal Science University of Arizona
Growth Curve for Cattle Bulls Maturity Steers Growth Units Heifer Puberty Castration Window of Acceptability. For cattle this is meat with a fat content of 3.0 to 7.3% or Select- to Choice+. Time Units
USDA Quality Grades Prime Choice Select
Show Animal Nutritional Requirements Starting Weight Days on Feed Finished Weight Grain % Steers (Med. Frame) 750 lbs. 1100 to 1150 lbs. 140 ** 70 Steers (Lg. Frame) 850 lbs. 1250 to 1350 lbs. 140 ** 70 **A 40 day adjustment period is required to bring to full finishing ration. For more information on Feeding Management for Show Steers, see http://ag.arizona.edu/pubs/animal/az1054.pdf
Receiving Period • Shots: 4 Way Respiratory (IBR, BVD,PI3, BRSV) 7 Way Clostridial • Monitor Feed and Water Intake (get up to 2% of body wt. intake) • Grass hay only for 3 days (unless used to alfalfa) • Change over to alfalfa hay (if desired) over a week • After 3 days, 25% alfalfa, at 5 days, 50%, at 7 days, 75%, at 9 days, 100% • 2 lbs. grain on day 4, feed for 3 days • 3 lbs. grain on day 7, feed for 3 days • 4 lbs. grain on day 10, feed for 3 days Watch for off feed Droopy ears Eye and nasal discharge Fever Blood in manure
Get up to 50% grain/50% hay ration Stepup Rations: After eating well the receiving ration (slick feed bunk) then increase grain in ration by no more 10% per week until 50% grain growing ration is being fed. Allow at least 40 days from the time calf is received to get to the finishing ration (70% grain diet). Goal for Growing Ration Watch for off feed Droopy ears Eye and nasal discharge Fever Blood in manure
Finishing Rations • Feed for 140 days to get proper finish • For 4-H steers, 70% grain in diet is usually adequate. • If more grain is needed to get gain desired, then need to add RumensinR or a similar product to the ration • If a steer goes off feed, reduce the grain and evaluate for sickness Which feed intake history is best?
What do I feed? See page 4 of “Feeding Management for Show Steers and Tables 1 and 2. Available at: http://ag.arizona.edu/pubs/animal/az1054.pdf • What does your steer weigh now? • What will the steer weigh at the fair? • How many days until the fair? • Is the steer a large or medium frame breed? • How much weight does the steer need to gain? How many lbs. per day? • How many lbs. per day will your steer eat (adjust for moisture in feed)? • 2.0% of body weight? • 2.5% of body weight? • 3.0% of body weight? • What TDN % needs to be in the ration to gain the weight desired (Table 2)? • What percentage grain do you need to get the TDN% desired (Table 1)? • What percentage protein should you have in the ration (Table 2)? • How much will it cost you to feed your steer out? • Can you estimate weight of the steer with a tape measure?
Estimating TDN and CP for a ration • TDN for a 50% grain, 50% hay ration: • .50 portion grain x 74% TDN = • .50 portion hay x 50% TDN = Total • CP for a 50% grain, 50% hay ration: • .50 portion grain x 12% CP = • .50 portion hay x 16% CP = Total
Determining a daily ration • How much does the steer weigh? • Example 750 lbs. • How much will it eat (Table 2)? • What percentage of grain (Tables 1 and 2)? • Calculate the ration: Example 70% grain, 30% hay • 20 lbs. feed intake x .70 portion grain = • 20 lbs. feed intake x .30 portion hay = Total
Measure length and heart girth in inches. Wt. In lbs. = (HG x HG x BL)/300
Speeding Up ADG • Increase the grain % • Add higher energy grains (corn) • Increase the amount fed • Slowing Down ADG • Decrease the grain % • Substitute lower energy grains (oats) • Reduce the amount fed • Exercise
Energy Content of Different Feeds Feed kilocalories/lb. feed* • Alfalfa Meal 1020 • Oats 1220 • Barley 1275 • Corn 1500 • Animal Fat 3550 * 1 human calorie = 1 kilocalorie or 1000 calories
USDA Yield Grades Quantify the ratio of fat to lean YG 1 Lean & heavy muscled YG 5 Fat & light muscled ars.sdstate.edu/ classes/AS101/01%20Beef%20Evaluation%20and%20sheep%20eval.ppt
USDA Yield Grade Step 1: • Determine back fat – starting point for determining Y.G. 12th rib depth inchesPreliminary Y.G. .0” 2.0 Most desirable .2” 2.5 .4” 3.0 .6” 3.5 .8” 4.0 1.0” 4.5 Least desirable ars.sdstate.edu/ classes/AS101/01%20Beef%20Evaluation%20and%20sheep%20eval.ppt
USDAQuality Grades Prime Choice Select Standard ars.sdstate.edu/ classes/AS101/01%20Beef%20Evaluation%20and%20sheep%20eval.ppt
Visual Indicators of Finish ars.sdstate.edu/ classes/AS101/01%20Beef%20Evaluation%20and%20sheep%20eval.ppt
Visual Indicators of Finish ars.sdstate.edu/ classes/AS101/01%20Beef%20Evaluation%20and%20sheep%20eval.ppt
Visual Indicators of Finish x x ars.sdstate.edu/ classes/AS101/01%20Beef%20Evaluation%20and%20sheep%20eval.ppt
Visual Indicators of Finish ars.sdstate.edu/ classes/AS101/01%20Beef%20Evaluation%20and%20sheep%20eval.ppt
Visual Indicators of Finish ars.sdstate.edu/ classes/AS101/01%20Beef%20Evaluation%20and%20sheep%20eval.ppt
Visual Indicators of Finish ars.sdstate.edu/ classes/AS101/01%20Beef%20Evaluation%20and%20sheep%20eval.ppt
Visual Indicators of Finish ars.sdstate.edu/ classes/AS101/01%20Beef%20Evaluation%20and%20sheep%20eval.ppt
Practice Comparisons 1100 lbs ars.sdstate.edu/ classes/AS101/01%20Beef%20Evaluation%20and%20sheep%20eval.ppt
Practice Comparisons 1330 lbs ars.sdstate.edu/ classes/AS101/01%20Beef%20Evaluation%20and%20sheep%20eval.ppt
USDA Quality Grades Prime Choice Select ars.sdstate.edu/ classes/AS101/01%20Beef%20Evaluation%20and%20sheep%20eval.ppt
Practice Comparisons Heifer – 1365 lbs ars.sdstate.edu/ classes/AS101/01%20Beef%20Evaluation%20and%20sheep%20eval.ppt
Practice Comparisons Steer – 1350 lbs ars.sdstate.edu/ classes/AS101/01%20Beef%20Evaluation%20and%20sheep%20eval.ppt
Practice Comparisons Heifer – 1365 lbs DP % - 60.6 HCW - 828 Back fat - .90” (PYG 4.3) RREA – 13.7 AREA - 10.8 (add .9) KPH fat – 3.5% (no adjustment) Final Y.G. 5.2 ars.sdstate.edu/ classes/AS101/01%20Beef%20Evaluation%20and%20sheep%20eval.ppt
Practice Comparisons Steer – 1350 lbs DP % - 64.0 HCW - 864 Back fat - .30” (PYG 2.7) RREA – 14.2 AREA – 16.2 (subtract .8) KPH fat – 2.5% (subtract .2) Final Y.G. 1.7 ars.sdstate.edu/ classes/AS101/01%20Beef%20Evaluation%20and%20sheep%20eval.ppt
Questions? For more information about feeding show steers, see: http://ag.arizona.edu/pubs/animal/az1054.pdf http://cnrit.tamu.edu/ganlab/filecabinet/64 http://www.unce.unr.edu/4H/programs/stem/files/pdf/BeefCattleProjectTexas.pdf