Exploring Genetic Variations in Humans and Mice: Insights into Structural and Molecular Polymorphisms
This study examines various genetic variations, including structural variations and single nucleotide polymorphisms (SNPs), across human and mouse genomes, especially in the context of Down's Syndrome. Analyzing a dataset with over 4 million DNA variants, we explore the significance of both SNPs and non-SNP DNA variations in understanding genetic diversity and evolutionary processes. This research highlights the utility of modern sequencing techniques and machine learning in enhancing SNP discovery and characterizing genetic polymorphisms, which are crucial for understanding phenotypic traits and population genetics.

Exploring Genetic Variations in Humans and Mice: Insights into Structural and Molecular Polymorphisms
E N D
Presentation Transcript
Genetic Variations Lakshmi K Matukumalli
Structural Variations Ploidy (Down’s Syndrome) Inversions Translocations Segmental duplications
Molecular Variations Single nucleotide polymorphisms Short Indels Simple sequence repeats Copy number variants Loss of heterozygosity Copy number variants Microsatellite (2-9 bp core repeat) Minisatellite (10-60 bp core repeat)
Type of polymorphisms Insertion/deletion polymorphism (indel) Nonsynonymous polymorphism Synonymous polymorphism Single-nucleotide Polymorphism (SNP) TAACGGTA GG GAG Asp GUG Val GAU Asp GAC Asp TC 5’ Untranslated region 3’ Untranslated region ATG End 5’ Flanking region 3’ Flanking region Promoter Coding Intron Coding Transcript
Extent of Variation (Human Genome) > 5 million SNPs (dbSNP) Recent genome analysis of diploid individual showed 4.1 million DNA variants, encompassing 12.3 Mb. - 3,213,401 single nucleotide polymorphisms (SNPs), - 53,823 block substitutions (2–206 bp), - 292,102 heterozygous insertion/deletion events (indels)(1–571 bp), - 559,473 homozygous indels (1–82,711 bp), - 90 inversions, - Plus segmental duplications and copy number variations. Non-SNP DNA variation accounts for 22% of all events, however they involve 74% of all variant bases. This suggests an important role for non-SNP genetic alterations in defining the diploid genome structure. Moreover, 44% of genes were heterozygous for one or more variants.
Importance of SNPs and other variants • Study Genetic variation in diverse populations in any species to • understand evolutionary origins and history, • estimate population size, • breeding structure, or life-history characters • Migration within and between sub-populations • Understand evolutionary basis for maintenance of genetic variation and speciation. • Applications • Genetic association of traits • Effects on gene expression (e.g., synonymous vs nonsynonymous / TF binding sites) • DNA finger printing or sample tracking
Fine Mapping with SNP Markers • Advantages of SNPs as genetic markers • as compared to microsatellites. • High abundance • Distribution throughout the genome • Ease of genotyping • Improved accuracy • Availability of high throughput • multiplex genotyping platforms
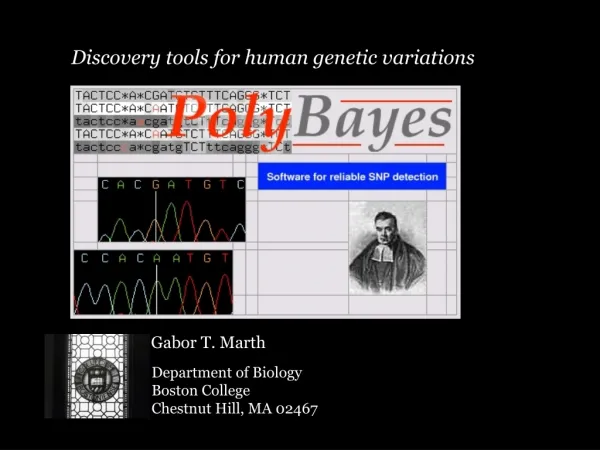
Primers 5’ amplicons 3’ amplicons Sequence Variation SNP-PHAGE (Software package) SNP Pipeline for Haplotype Analysis and GEnbank (dbSNP) submissions. Important steps are • Primer development • Primer testing • Sequencing • Base calling, • Sequence assembly • Polymorphisms analysis • Haplotype analysis • GenBank submission of confirmed polymorphisms
Inputs Outputs Inputs Machine Learning Program Planning and Reasoning Model (Tree /Rules) Model (Tree / Rules) Outputs Training mode Testing/Prediction mode Application of Machine Learning in SNP Discovery Objective: Reduce human intervention by using expert annotated dataset for training a Machine learning (ML) program and use it to differentiate good/bad polymorphisms • Steps: • Parameter Selection • Parameter Optimization • Testing • Implementation. • Results: • Achieved substantial improvement in the accuracies as compared to using only polybayes or polyphred.
SNP Discovery using next generation sequencers • Short sequences 23-35 bp long at a fraction of cost. • Reduced Representation Sequencing • Digest genomic DNA with restriction enzyme • Screen based on in silico digestion • Size select based on • Repetitive DNA • Number of fragments • Sequencing platform • Allows “targeted” deep sequencing of pools of DNA • Randomly distributed Cost / Mb ABI $880 454 $160 Solexa $5
SNP Discovery - Bioinformatics • Strategies to maximize performance • High quality score stringencies • For each read • At base for putative SNP • Require single map location of a 23-bp “tag” (and 4-bp restriction site) • Allow only one single base pair difference match for a putative SNP • Reduces repeat content • Reduces gene family/paralog false positives • Require 2 copies of each allele – assembly can count as 1
X Population Genetics Population genetics is the study of the allele frequency distribution and change under the influence of the four evolutionary forces: natural selection, genetic drift, mutation and gene flow. It attempts to explain phenomena as adaptation and speciation. (www.wikipedia.org) Variation
Population Genetics Neutral theory : Rate at which new genetic variants are formed is equal to the loss of genetic diversity due to drift. Genotypes : CT, CC, TT Alleles : C and T C/T C/C T/T Genotyping of a population of 1000 individuals for a SNP resulted in 100, 500 and 400 genotypes for CC, CT and TT respectively Genotype Frequencies: CC (0.1), CT (0.5) and TT(0.4) Allele Frequencies: C (p) = (200+500)/2000 = 0.35 (minor allele -- MAF) T (q) = (500+800)/2000 = 0.65 (major allele) Hardy-Weinberg Equilibrium: Expected genotype frequencies are p2, 2pq and q2 (122, 422 and 455) HWE Deviations: Drift, Selection, Admixture etc.,
Fst • Useful to partition genetic variation into components: • within populations • between populations • among populations • Sewall Wright’s Fixation index (Fst is a useful index of genetic differentiation and comparison of overall effect of population substructure. • Measures reduction in heterozygosity (H) expected with non-random mating at any one level of population hierarchy relative to another more inclusive hierarchical level. • Fst = (HTotal - Hsubpop)/HTotal • Fst ranges between minimum of 0 and maximum of 1: • = 0 no genetic differentiation • << 0.5 little genetic differentiation • >> 0.5 moderate to great genetic differentiation • = 1.0 populations fixed for different alleles
Genotype – Phenotype Association (Significance of Haplotypes)
Haplotype inference • The solution to the haplotype phasing problem is not straightforward due to resolution ambiguity • Computational and statistical algorithms for addressing ambiguity in Haplotype Phasing: 1) parsimony 2) phylogeny 3) maximum-likelihood 4) Bayesian inference
Linkage disequilibrium (LD) • Non-random association of alleles at two or more loci, not necessary in the same chromosome. • LD is generally caused by interactions between genes; genetic linkage and the rate of recombination; random drift or non-random mating; and population structure. Let A and B be two loci segregating two alleles each; a1 and a2 with frequencies p1 and p2 in A, and b1 and b2 with frequencies q1 and q2 in B. B1 B2 Total A1 p11 = p1 q1 + D p12 = p1 q2 - D p1 A2 p21 = p2 q1 - D p22 = p2 q2 + D p2 Total q1 q2 1 A B
D If D < 0 min(p1q1 , p2q2) D’ = D If D > 0 min(p1q2 , p2q1) Linkage disequilibrium (cont) D = p11 - p1q1 D depends on the allele frequencies at A and B. D’ a scaled version of D:
Linkage disequilibrium (cont) • Squared correlation coefficient D2 r2 = p1p2q1q2 * The measure preferred by population geneticists * Is independent of of allele frequencies * Ranges between 0 and 1 * r2 = 1 implies the markers provide exactly the same information * r2 = 0 when they are in perfect equilibrium
2.4 Linkage disequilibrium (cont) • Visualizing LD
2.4 Linkage disequilibrium (cont) • Visualizing LD