Download
1 / 36
360 likes | 365 Vues
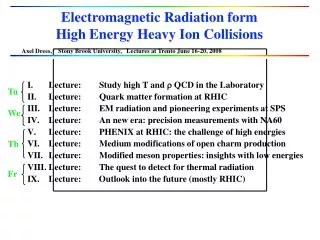
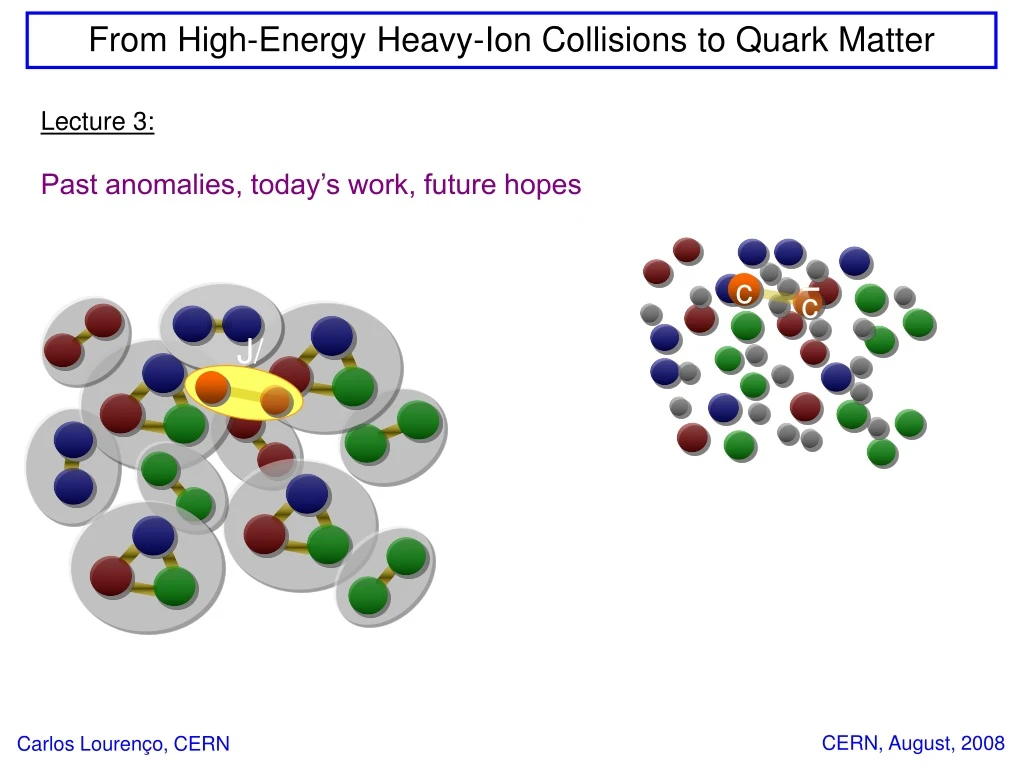
c. J/ . From High-Energy Heavy-Ion Collisions to Quark Matter. Lecture 3: Past anomalies, today’s work, future hopes. c. CERN, August, 2008. Carlos Louren ç o, CERN. E T (GeV). A “new physics” signal or a “not yet good enough” reference?.

E N D
c J/ From High-Energy Heavy-Ion Collisions to Quark Matter Lecture 3: Past anomalies, today’s work, future hopes c CERN, August, 2008 Carlos Lourenço, CERN
ET (GeV) A “new physics” signal or a “not yet good enough” reference? Some years ago CDF measured jet productionin proton-antiproton collisions and compared the data to perturbative QCD calculations. The data points seem to agree very well with the calculation… Except if you look at the high ET tail…on a linear scale, as (data-theory) / theory Is this “high ET excess” a signal of quarkcompositeness ?
Reminder: what are the protons made of ? pQCD calculates partonic processes, like qq → qq, qg → qg, gg → gg But our beams (and targets) are made of protons, neutrons, antiprotons...not of quarks and gluons ! The probability that we find quarks, anti-quarks or gluons inside a proton depends on their fractional momenta and on the “resolution” of our probe: f (x,Q2) parton distribution functions, PDFs gluons valencequarks seaquarks
D(z) PDFs pQCD PDFs D(z) From hadrons to partons… and back People operate particle detectors, not parton detectors... To get hadron spectra, we need to convolute the hard interaction with (initial state) parton densities and (final state) fragmentation functions, which define how the quarks and gluons hadronise. The PDFs and the fragmentation functions are (supposed to be) the same for all processes. partons (calculation) hadrons (measurement)
Hard Scatter Calculation Parton Density Functions DIS e- e- Drell-Yan l+ g g l- q q 5 experiments Cross Section Calculation Measurement
New data new PDFs improved reference Each class of experiments (DIS, Drell-Yan, etc) gets part of the story;no single experiment sees the full picture of the proton The results from each experiment go into a global fitNot all measurements agree – there is an art to “average” them together Two main groups are experts in this art :→ Martin, Roberts, Stirling and Thorne MRST→ Coordinated Theoretical-Experimental project on QCD CTEQ New Parton Distribution Functions were fitted, including the CDF data The measurement is the same but the “excess” is gone, using the new reference Important lesson: the “new physics signal” was due to a wrong reference
c J/ Quarkonia melting: a clean signal of QGP formation In a deconfined medium, the QCD potential is screened and the heavy quarkonium states are “dissolved” into open charm or beauty mesons c Lattice QQbar free energy Charmonium melting should be easy to see experimentally, as a strong suppression of the J/ and ’ production yields T
The feed-down from higher states leads to a “step-wise” J/suppression pattern ’ c J/ cocktail: ~ 65% direct J/ ; ~ 25% from c decays ; ~ 10% from ’ decays Quarkonia melting probes the QGP temperature Different heavy quarkonium states have different binding energies and, hence, are dissolved at successive thresholds in energy density or temperature of the medium; their suppression pattern works as a “thermometer” of the produced QCD matter Bottom line : thresholds steps a QGP “smoking gun signature”
p-Be p-Pb centralPb-Pb reference process reference data S-U p-A Pb-Pb J/ normal nuclear absorption curve NA38 / NA51 / NA50 Drell-Yan dimuons are not affected by the dense medium they cross J/y suppression in S-U and Pb-Pb collisions (NA38+NA50) The yield of J/ mesons (per DY dimuon) is “slightly smaller” in p-Pb collisions than inp-Be collisions; and is strongly suppressedin central Pb-Pb collisions Interpretation:strongly bound c-cbar pairs (our probe) are “anomalously dissolved” by the QCD medium created in central Pb-Pb collisions at SPS energies
J/y suppression in In-In collisions (NA60) In-In 158 GeV normal nuclear absorption ~ 29 000 J/ dimuons NA60 collected less J/ events in In-In than NA50 in Pb-Pb but the accuracy of the pixel vertex tracker allows us to directly compare the measured yields to the normal nuclear absorption curve, derived from the p-nucleus data with the “Glauber model”, without using the Drell-Yan reference (very limited in statistics)
J/y suppression: In-In versus Pb-Pb patterns The Pb-Pb and In-In suppression patterns overlap in Npart or energy density; the statistical accuracy of the In-In points is very good The pink box represents the ±6% global systematic uncertainty in the relative normalization between the In-In and the Pb-Pb data points
The In-In J/y suppression pattern versus a step function 1 Measured / Expected A1 A2 Npart Step position Step at Npart = 86 ± 8 A1 = 0.98 ± 0.02 A2 = 0.84 ± 0.01 2/ndf = 0.75 (ndf = 8-3 = 5) Taking into account the EZDC resolution, the measured pattern is perfectly compatible with a step function in Npart
1 Measured / Expected A1 A2 A3 Npart Step positions What about the Pb-Pb suppression pattern? Steps: Npart = 90 ± 5 and 247 ± 19 A1 = 0.96 ± 0.02 A2 = 0.84 ± 0.01 A3 = 0.63 ± 0.03 2/ndf = 0.72 (ndf = 16-5 = 11) 12% : ’ ! 21% : c ! If we try fitting the In-In and Pb-Pb data with one single step we get 2/ndf = 5 ! the Pb-Pb pattern rules out the single-step function and indicates a second step
Solutions: Capella & Ferreiro = 49 Digal et al. = 21 Rapp (fixed t0) = 14 Rapp (variable t0) = 9 The In-In J/y suppression pattern versus non-QGP models S. Digal et al. EPJ C32 (2004) 547 These models were “tuned” on the Pb-Pb pattern… but fail to describe the In-In suppression pattern... Exercise: calculate the 2/ndf for eachof these curves (ndf = 8) R. Rapp EPJ C43 (2005) 91 centrality dependent t0 In-In 158 A GeV R. Rapp EPJ C43 (2005) 91 fixed termalization time t0 A. Capella, E. Ferreiro EPJ C42 (2005) 419 The In-In data sample was taken at the same energy as the Pb-Pb data...to minimise the “freedom” of the theoretical calculations
All data “rescaled” to 158 GeV y’ y’ What about the ’ suppression pattern? The y’ suppression in Pb-Pb collisions (at 158 GeV) is significantly stronger than expected on the basis of the absorption observed in p-A data (at 400450 GeV) y’ sabs = 8.3 ± 0.9 mb c2/ndf = 1.4 Is the abrupt “change of slope” due to the formation of the QGP state ? or due to an increase of sabsbetween 450 and 158 GeV ?
“Anomalous suppression” vs. “normal nuclear absorption” In a medium with deconfined quarks and gluons, the QCD potential is screened and the heavy quarkonium states are “dissolved” into open charm or beauty mesons → we have a “signature” Above certain consecutive thresholds, the y’, the cc and the J/y resonances (and the Upsilon states) will “dissolve” in the formed medium → we have a “smoking gun”... However, already in p-nucleus collisions the charmonium states are absorbed by “cold nuclear matter effects” This “normal absorption” must be well understood before convincing evidence of colour deconfinement can be derived from the J/ and ’nucleus-nucleus data Could the charmonium suppression be due to a wrongly determined reference?Recall the high ET “excess” seen by CDF… We must carefully review the determination of the “normal nuclear absorption” and look for possible problems… “What gets you into trouble is not what you don’t know… but what you think you know” Mark Twain
abs = 4.5 ± 0.5 mb abs = 8.3 ± 0.9 mb Be Al Cu Ag W Pb c2/ndf = 0.7 c2/ndf = 1.4 The “normal nuclear absorption” revisited The J/y and y’ production cross sections scale less than linearly with the number of target nucleons. The “Glauber model” describes the “normal nuclear absorption” with a single parameter, the absorption cross section: sabs The NA50 calculations neglect the nuclear effects on the PDFs and the feed-down sources of J/’s from c and ’ decays; and assume that sabsdoes not change with collision energy or kinematics, besides a few other assumptions…
EPS 08 gluon density function in Pbgluon density function in p Anti-shadowing EKS 98 Shadowing Nuclear PDFs versus charmonium nuclear absorption The probability of finding a gluon in a proton changes when the proton is inside a nucleus; these nuclear effects can be calculated, by “EKS98” and other models When we consider EKS98 N-PDFs, abs changes from 4.60.5 mb to 6.90.5 mbThere is also significant evidence that abs changes with energy, pT and rapidity…
Just when we were about to find the answer…we forgot the question… The predicted patterns were quite different from each other Theorists told us that it was going to be very easy to discriminate between the two scenarios... normal nuclearabsorption J/ survival probability suppressionby QGP c Energy density We made measurements, to rule out one of these two scenarios (or both)
Can any of the models describe the data points seen at CERN ?
“outlier” point;to be rejected normal nuclearabsorption All kept data points agree with the expected normal nuclear absorption pattern!
calibrationerror anomaloussuppression All kept data points agree with the expected QGP suppression pattern!
The lessons of the day… 1) There is a BIG difference between “the measurements are compatible with the model expectations...” and “the measurements show beyond reasonable doubt that the model is good” 2) “Nature never tells you when you are right, only when you are wrong” Hence, you only learn something when the theory fails to describe the data... [Bacon, Popper, Bo Andersson] 3) Before the measurements are made, theorists often say that the interpretation of the data will be easy Theorists are often wrong... especially before the measurements are made...
The LHC: the next chapter in the QGP saga… • AGS : 1986 – 1998 : up to Au-Au at s = 5 GeV properties of the hadronic phase • SPS : 1986 – 2003 : O, S, Pb and In beams ; s = 20 GeV • J/y and y’ (and cc ?) suppression deconfinement • compelling evidence for a “new state of matter” with “QGP-like properties” • RHIC : 2000 – ?? : Cu-Cu, Au-Au at s = 200 GeV • parton energy loss (jet quenching) • parton flow compelling evidence for a strongly-coupled QGP (“the perfect fluid”) • LHC : 2009 – ?? : Pb-Pb at s = 5500 GeV • jets, upsilons, charm, beauty, thermal photons precision spectroscopy • continue exploration of high-density QCD properties
Hard Probes of QCD matter at LHC energies • Very large cross sections at the LHC • Pb-Pb instant. luminosity: 1027 cm-2s-1 • ∫L dt = 0.5 nb-1 (1 month, 50% run eff.) • Hard cross sections: Pb-Pb = A2 x pp • pp-equivalent ∫L dt = 20 pb-1 • 1 event limit at 0.05 pb (pp equiv.) pp s = 5.5 TeV 1 mb J/y 1 nb h+/h- jet Z0+jet g*+jet 1 pb gprompt 1 event
Solenoid magnet 0.5 T • Forward detectors: • PMD • FMD, T0, V0, ZDC ALICE • Central tracking system: • ITS • TPC • TRD • TOF • Muon spectrometer: • absorbers • tracking stations • trigger chambers • dipole • Specialized detectors: • HMPID • PHOS
h±, e±, g, m± measurement in the CMS barrel (|| < 2.5) Si Tracker + ECAL + muon-chambers CalorimetersECAL PbWO4HCAL Plastic Sci/Steel sandwich Si TrackerSilicon micro-stripsand pixels Muon BarrelDrift Tube Chambers (DT)Resistive Plate Chambers (RPC)
Charm and beauty production • The charm production cross section at s = 5.5 TeV is ~10 times higher than at RHIC and ~100 times higher than at the SPS • Central Pb-Pb collisions will produce ~100 c-cbar pairs and ~5 b-bbar pairs! • Several physics topics can be studied for the first time (heavy quark energy loss in the medium, charm thermalisation, etc) • The detection of D and B mesons requiresan accurate determination of the collisionvertex and of the distance between theextrapolated charged tracks and the vertex,in the transverse plane and in the beam axis • Typical impact parameters: a few 100 mmfor D decays and ~500 mm for B mesons
Reconstruction of D0 K-p+ decays in ALICE • Large combinatorial background • Main selection cuts: • pair of opposite-charge tracks with large impact parameters • good pointing of the reconstructed D0 momentum to the primary vertex simulation D0 Invariant mass analysis simulation
Measuring beauty yields from displaced J/y production promptJ/y CMS : J/ym+m- Alice : J/y e+e- J/yfrom B simulation A large fraction of the J/y mesons observed at the LHCwill come from decays of B mesonsThey can be separated from the “prompt” J/y mesons because they are produced away from the collision vertex
Quarkonia studies in ALICE simulation Rapidity window: 2.4–4.0 Resolution:70 MeV at the J/y100 MeV at the Y Mmm (GeV/c2) After combinatorial background subtraction : J/y ’ ’’ Mmm (GeV/c2)
Barrel + endcaps: muons in |h| < 2.4 Barrel: both muons in |h| < 0.8 Acceptance pT (GeV/c) → m+m- in CMS simulation CMS has a very good acceptance for dimuons in the Upsilon mass region(21% total acceptance, barrel + endcaps) The dimuon mass resolution enablesthe separation of the three Upsilon states:~ 54 MeV within the barrel and~ 86 MeV when including the endcaps
pT (GeV/c) h J/y→ m+m- in CMS • The material between the silicon tracker and the muon chambers (ECAL, HCAL, magnet’s iron) prevents hadrons from giving a muon tag but impose a minimum muon momentum of 3.5–4.0 GeV/c. This is no problem for the Upsilons, given their high mass, but sets a relatively high threshold on the pT of the detected J/y’s. • The dimuon mass resolution is 35 MeV, in the full h region. J/y barrel +endcaps Acceptance barrel +endcaps simulation barrel pT (GeV/c)
pT reach of CMS quarkonia measurements (for 0.5 nb-1) Expected rec. quarkonia yields: J/y : ~ 180’000 : ~ 26’000 ’ : ~ 7’300; ’’ : ~ 4’400 ● produced in 0.5 nb-1 ■ rec. if dN/dh ~ 2500 ○ rec. if dN/dh ~ 5000 J/y Pb-Pb Similar low pT yields for J/y and with HLT simulation
The CMS High Level Trigger • CMS High Level Trigger: 12 000 CPUs of 1.8 GHz ~ 50 Tflops ! • Processes full events with fast versions of the offline algorithms • pp L1 maximum trigger rate : 100 kHz • Pb-Pb collision rate : less than 8 kHz • pp L1 trigger rate > Pb-Pb collision rate the HLT can process all Pb-Pb events • Average HLT time budget per event: ~10 s • The samples of rare events are enhanced by very large factors Pb-Pb at 5.5 TeV design luminosity ET reach x2 jets x35 x35
Take home messages Nature’s secrets are never easy to uncover and much detective work is needed to understand how the Universe’s most fundamental building blocks (the quarks and gluons) interact in the extreme densities and temperatures which existed just after the Big Bang, before protons and neutrons were formed. The SPS data revealed some “exquisite anomalies”, surprisingly similar to what was predicted in case of QGP formation; has a “new state of matter” really been formed? RHIC was built to study the QGP, thought as agas of quarks and gluons. Instead, it served a nearly perfect liquid, an even more remarkable state of matter, where the particles flow as one entity. The LHC (Large Heavy-ion Collider) will surely also provide intriguing revelations… if we don’t get lost on the way… Good luck !