Download
1 / 18
180 likes | 313 Vues
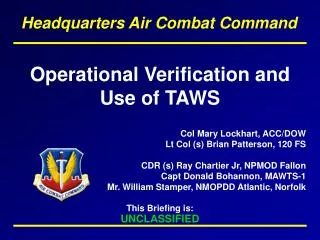
Operational Description Werner Magnes Institut für Weltraumforschung (IWF) Austrian Academy of Sciences. FGM Block Diagram. FGM Signal Flow (F20). 2 x Boxcar filter. FGM signal flow. amplitude response. phase response. N ... number of accumulated samples

E N D
Operational Description Werner Magnes Institut für Weltraumforschung (IWF) Austrian Academy of Sciences
FGM Signal Flow(F20) 2 x Boxcar filter • FGM signal flow amplitude response phase response N ... number of accumulated samples T ... sampling period (1/(4F0) or 128 Hz)
Frequency Response (F20) • FGM raw data amplitude response of the 128 Hz raw data phase response of the 128 Hz raw data
Filter Modes(F20) • FGM filter modes • Filter mode 1: • only data decimation (D) • 4 Hz data with 5.7 x higher noise • huge aliasing • no de-spinning problems • Filter mode 2: • filter calc. down to 16 Hz (Nf) • decimation from 16 to 4 Hz • 4 Hz data with 2 x higher noise • less aliasing • little de-spinning problems • Filter mode 3: • filter calc. down to 4 Hz • little aliasing • de-spinning problems Nf ... number of accumulated samples in table Tr ... raw data rate (1/128) Number of data decimation (D) and accumulation (Nf) according to the selected filter mode
Frequency Response(F20) • FGM TML data Amplitude characteristics of the 128 Hz raw data as well as the 64 Hz and 32 Hz output data (filter mode 2 and 3) Amplitude characteristics of the 16 (filter mode 2 and 3), 8 and 4 Hz (filter mode 3) output data
AC-Field Distortion • Spin tone distortion (1) B-field data measured by magnetometer on spinning S/C (4) Box car filter causes amplitude attenuation and phase shift (2) Assumed AC field (Bx=By=0) (5) Final de-spinning (3) Mag components with left- and right-hand polarized terms
Frequency Response • Frequency response around spin-frequency amplitude response phase response
AC-Field Distortion Spin tone distortion spin period = 3 sec; Bz = 1 nT; fz = 0.4 Hz; By = 0 nT;filter mode 3: 4 Hz spin period = 3 sec; Bz = 1 nT; fz = 0.4 Hz; By = 0 nT;filter mode 3: 16 / 8 / 4 Hz
AC-Field Distortion Spin tone distortion spin period = 3s; Bz = 1 nT; fz = 1 Hz; By = 0 nT;filter mode 3: 4 Hz spin period = 3s; Bz = 1 nT; fz = 1 Hz; By = 0 nT;filter mode 3: 16 / 8 / 4 Hz
Large Fields (F4) Large field feedback (VEX-MAG) ±900 nT; 3 Hz; 128 Hz FB update max. FB step of 130 nT; STD residuum: 54 pT STD noise: 48 pT (0.5 .. 64 Hz) ±900 nT; 0.3 Hz; 128 Hz FB update max. FB step of 13 nT; STD residuum: 53 pT (0.1 .. 64 Hz) ±900 nT; 0.03 Hz; 128 Hz FB update; max. FB step of 1.3 nT; STD residuum: 56 pT (0.04 .. 64 Hz)
Block diagram DAC linearitiy test DAC Linearity Check (F3) • DAC linearity check • National Instruments 16-bit ADC card with digital I/O • 12-bit DAC under test stepped through all 4096 output voltages • 100 measurements per step; mean value and standard deviation • Comparison with nominal value for integral non-linearity • Comparison of real with ideal voltage step for differential non-linearity
DAC Linearity Check (F3, F19) DAC linearity check
DAC Linearity Check (F3, F19) DAC differential and integral non-linearity … and a bad one. A good …
FGM Ranges (F3, F19) • Consequences of DAC non-linearity on measurement accuracy • Dynamic range of ± 32,768 nT (24 bits) • Digital resolution of approx. 4 pT • Fine (12 bits) and course (6 bits) feedback DAC • Dynamic range of fine DAC is ± 512 nT with 0.25 nT resolution • Maximum error due to DNL in fine (‚science‘) range of 58 pT • Digital resolution of 14 bits in fine range • Dynamic range of course DAC is ± 32,768 nT with 1024 nT resolution • Maximum error due to DNL in course range of 7.8 nT (13 bits) • Digital resolution of 13 bits in course range
Operation • FGM turn-on • At least Start command from Data Control Board • Default values for phase, sampling, K-values, offsets and averaging mode stored in FPGA • Start of data acquisition with one second sync • No in-flight configuration storage • FGE standard mode • Field calculation: k1*ADC+k2*DAC+Offset (@ 128 Hz) • 24 bits per axis (LSB ~ 4 pT - 32,000 nT range) • TML output: 4 Hz data in filter mode 2 • IDPU tasks • Auto ranging by taking only 16 bits per axis • Calculation of spin-average data (Slow Survey Modes)
Operation • FGM operation during all science phases • Slow Survey: 1 vector / spin • Fast Survey: 4 vectors / sec • Particle Burst: 32 vectors / sec • Wave Burst 1/2: 128 vectors / sec • FGM operation during boom deployment • Check of the magnetic moment of the S/C • FGM operation during complete checkout phase • Survey of DC and AC magnetic disturbances
Operation • FGM operation during special mission phases • Change of orbit • Eclipse • Special use of FGM data • S/C attitude control in perigee • Knowledge of FGS axes to spin axis orientation • During perigee knowledge of FGS axes relative to a geophysical reference system with 0.1 degree accuracy (requestfor a 56 nT accuracy in course feedback range)