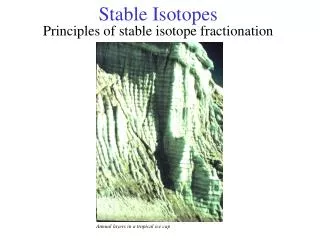
Stable Isotopes
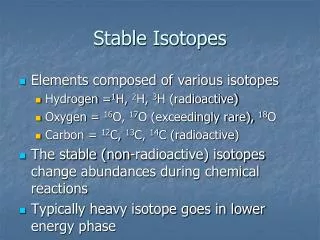
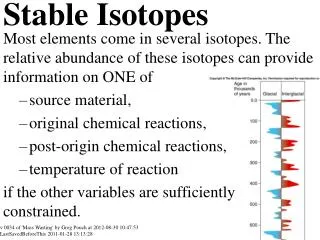
Stable Isotopes. Most elements come in several isotopes. The relative abundance of these isotopes can provide information on ONE of source material, original chemical reactions, post-origin chemical reactions, temperature of reaction if the other variables are sufficiently constrained.

Stable Isotopes
E N D
Presentation Transcript
Stable Isotopes Most elements come in several isotopes. The relative abundance of these isotopes can provide information on ONE of • source material, • original chemical reactions, • post-origin chemical reactions, • temperature of reaction if the other variables are sufficiently constrained. v 0034 of 'Mass Wasting' by Greg Pouch at 2012-08-30 10:47:53 LastSavedBeforeThis 2011-01-28 13:13:28
Stable Isotopes 3 Definitions 4 Equivalent Definitions with Examples 5 Isotopic Ratios ‰ 6 Processes 7 Example Process: Water vaporizing and crystallizing 8 What Factors Influences Isotopic Ratios? What are Stable Isotopes Ratios used for 9 What Can You Do with Isotopic Ratios? or Why am I telling you about this 10 What CAN'T You Do with Isotopic Ratios? 11 Example: Rainwater 12 Example: Where Do Hot Springs Get Water? 13 Where Does Floodwater Come From? 14 Example: Paleo-Temperatures 1 15 Example: Paleo-Temperatures 2 16 Further Reading
Definitions • Atoms are composed of protons, neutrons, and electrons. • Protons and electrons are charged. • Protons and neutrons are found in the nucleus. • Atoms can gain or lose some electrons fairly easily, so the number of electrons in an atom reflects its chemical state, or is its chemical state, and is not an intrinsic property. • Protons and neutrons (collectively: nucleons) are hard to gain or lose. The number of protons causes an atom to have certain chemical properties (be of an element). The count of protons in a nucleus is its atomic number, which defines what element it is. (Helium has an atomic number of 2, meaning it always has 2 protons). The number of protons plus neutrons in an atom is its mass number. (Helium is usually 4 or 3). • An atom with two protons (and therefore helium) and two neutrons can be written as • 4He, • He-4, • Helium-4, • He4 • The number of neutrons in a nucleus is roughly correlated with the number of protons. Atoms of an element can have different numbers of neutrons. Each different mass number is an isotope of the element. Some isotopes are stable, others are unstable.
Equivalent Definitions with Examples • Here two equivalent definitions of element and isotope • A nucleus with a certain number of protons and a certain number of neutrons is of certain isotope. • A nucleus with a certain number of protons and any number of neutrons is of a certain element. or • All nuclei of a given isotope have equal numbers of protons and equal numbers of neutrons. • All nuclei of a given element have equal numbers of protons. • Examples • Nucleus A with 1 proton and one neutron and nucleus B with just one proton and zero neutrons are nuclei of hydrogen, but are different isotopes. (A is 2H and B is 1H) • Nucleus C with 8 protons and 8 neutrons is 16O (atomic number 8 so Oxygen, mass number 16) • Nucleus D with 8 protons and 10 neutrons is 18O (also atomic number 8, but mass number 18) • Nucleus E with 9 protons and 9 neutrons is 18F • Nucleus F with 10 protons and 8 neutrons is 18Ne • The letter denotes the element, and the leading subscript is the mass number. You also sometimes see this written like U-235 where the mass number follows. • The number of protons determines the charge on the nucleus, and thus how many electrons the atom "wants" and what compounds the atom can be part of: the chemical identity is controlled by the number of protons.
Isotopic Ratios ‰ • Most elements consist of a mixture of different isotopes, and this controls the atomic weight. • It turns out that the atomic weight of an element, measured to high enough precision, depends on where the sample came from, since the mixture of isotopes varies. (For a while, accurately determining atomic weights was considered useful work for chemists, until they figured out that the atomic weight could vary.) • How the atomic weight varies with "where the sample comes from" is the basis of isotope geology. • We don't actually get atoms, count out a mole of atoms and weigh them accurately: we take a specimen, put it into a mass spectrometer, and measure the relative abundance of the isotopes. • Directly off a mass spectrometer, you would get inconvenient numbers like sample A's oxygen is 0.20052% 18O compared to Sample B's 0.20253% . So instead, we normalize to a standard sample (defined for each stable isotope of interest, and often an actual specimen that you order chunks of) using this formula which you probably don't need to know but should see and try to understand δ18Osample =Delta 18Osample = 1000* ( [18Osample] / [16Osample] ) - ( [18Oref] /[16Oref] ) ) / ( [18Oref] /[16Oref] ) Delta 18Osample = 1000* ( ratio in sample - ratio in reference ) / (ratio in reference) • In the above formula, the • [a] means concentration of a • numerator is difference between the isotopic ratio in the sample and a reference • the denominator is the isotopic ratio of the reference • the factor of 1000 forces the numbers to a convenient range. The value is then per mil, shown as ‰ • This is shown for 18O. The general form is rare-isotope/common-isotope and the standard is either widely accepted, or indicated explicitly • Geologists almost always use ‰ per mil notation when expressing isotopic ratios, often without including the ‰ since it's not a keyboard.
Processes • Source • Different reservoirs of oxygen, or hydrogen, or whatever can have different isotopic ratios. ("isotopic signatures", although "forgery" is way too easy for the analogy to work well.) For example, water coming from the mantle in volcanoes has a different isotopic ratio than water in the oceans, and water that falls as rain has isotopic ratios of hydrogen and oxygen that vary together in a very predictable way. • If a reaction goes to completion, the products and reactants have the same total isotopic compositions. • Chemical Bonding and Fractionation • The number of protons+neutrons=mass_number has an influence on how easy it is to break a bond. If you have two bonds that are identical except for differing isotopes, the bond involving the lighter isotope will break more readily. • In chemical reactions, different isotopes of an element react similarly but not exactly the same: a lighter isotope is a little more reactive/volatile than a heavier isotope, and this difference is more pronounced at lower temperatures. (for 1H and 2H, it's not slight, and 2H even has its own name: deuterium) • In reactions that go to completion (are strongly favored thermodynamically), this makes no difference and the products will have the same ratio as the source. • In chemical reactions that don’t go to completion, this leads to isotopic fractionation in the products: the isotopic ratios in the product are not the same as the isotopic ratios in the reactants. The stuff that did react will be lighter than the input, and the stuff that did not react will be heavier (or vice versa, depending on whether the reaction is exothermic or endothermic). If you think of heavy isotopes as being "colder" than lighter isotopes, you'll have a good feel for how the reaction will fractionate the isotopes. • The degree of fractionation is very predictable for a given chemical reaction and set of conditions. • What controls isotopic fractionation • Chemical reaction, including biological influences (For example, corn produces much more strongly fractionated carbon than wheat does.) • Temperature • Pressure does not play a large role.
Example Process: Water vaporizing and crystallizing • Water is made of 1H, 2H, 16O and 18O (and very minor 3H and 17O). • When water evaporates, the lighter isotopes 1H and 16O vaporize more readily, so that the vapor is enriched in light isotopes and the residual liquid is enriched in heavy isotopes 2H and 18O. • Similarly, when ice crystallizes from vapor (cloud formation), heavy isotopes are concentrated in the solid phase and light isotopes are residually concentrated in the vapor phase. • By measuring the isotope ratios in rainfall, you can tell how "far" the water is from the sea (its origin), if it all vaporized from water of the same composition at the same temperature.
What Factors Influences Isotopic Ratios? • Three factors influence the final isotopic ratio: • what did you start with it, • what happened to it first, • what happened after that Initial ratio in reactants Different sources have different ratios. For example, water from the mantle has different isotopic ratios than seawater. The isotopic ratio of 13C to 12C in the atmosphere has changed over geologic time, due to such influences as removing fractionated carbon into carbonate beds or oil. • Original fractionationreaction including biological mediation, temperature • Post-origin fractionation reaction including biological mediation, temperature • Example: clouds The isotopic composition of a cloud depends on ALL of • the isotopic composition of the water it came from • the reaction (vaporizing water) and the temperature it happened at • post-origin reactions like crystallizing ice or forming water droplets, and the temperature they happened at. • Even in the very simple case of rainfall, all three factors come into play.
What Can You Do with Isotopic Ratios?or Why am I telling you about this If you measure isotopic ratios and know enough ancillary information, you might be able to view one of the factors as a control on isotopic ratio. For accurate interpretation of isotopic ratios from a single mineral, • to get original fractionation (e.g., for temperature), you must know the reaction that happened, the ratios in source (s), and any later reactions • to get initial ratios (e.g., source of water in a clay), you need control on the original reaction including temperature and any subsequent reactions • to get post-origin fractionation, you need control on the initial ratios and on the original reaction including temperature. For example, modern seawater has pretty constant composition and we know the isotopic fractionation of evaporating water including its temperature dependence, and by measuring the isotopic ratios in water vapor, we can estimate the temperature at which it evaporated. If we did not know the vapor came from evaporating seawater but might have come from evaporating some other source, our measurement could result from a huge suite of possible combinations of temperature and source isotopic ratios If you have two reactions in thermodynamic equilibrium happening at the same time (like crystallization of plagioclase from a magma and crystallization of pyroxene from a magma), they have the same source, they reacted at the same temperature, so you can find the temperature by the difference in the fractionation of the two minerals, assuming that no post-crystallization reactions happened. (This can be converted into an algebra problem.) (We assume/observe a lack of post-crystallization reaction, and we're left with reaction+temperature and source, but we have two variables and two equations, which MIGHT let us solve for both source and temperature. .
What CAN'T You Do with Isotopic Ratios? There are a lot of attempts to use carbon or oxygen isotope ratios as paleo-thermometers. The difficulty lies in having adequate control on initial reservoir ratio, the reaction, and post-deposition reactions to reliably interpret this as temperature. Isotope geology requires painstaking attention to detail and is often thwarted by contamination and poor controls. Unfortunately, there is much wishful thinking leading to some investigators who take a sample, measure isotopes, and interpret the values as temperature, or rainfall, or whatever they want to be the one controlling factor, without having adequate control on the other factors. Worse, some will take specimens from a particular location and interpret them as indicating "global" temperatures or isotopic ratios or whatever, when, at best, they could indicate the temperature at that location when the specimen formed.
Example: Rainwater • This figure shows a contour map (lines of equal value) of 2H ratio (and 18O in finer print). It is based on measurements of annual composition of rainwater at many locations. • In the interior of the continent, it shows a strong falloff with distance from the Gulf of Mexico, indicating that most water that falls as rain came from the Gulf. • On the west coast, it shows a steep falloff as you move away from the Pacific, but this pattern breaks up quickly due to the mountains pulling much moisture out of the air, so that sometimes Gulf air masses provide water, and other times Pacific air masses provide water. • On the east coast, you see a gentle falloff from Atlantic. Some of the moisture comes off the North Atlantic, some from the Gulf of Mexico. • Note that the far northern Atlantic (Newfoundland, northern Quebec) does not produce much evaporation, which makes sense because it's cold. All of this agrees well with what we now know from weather-satellite water-vapor images. • By knowing the isotopic composition of water in a plant, and the type of plant (and its fractionation tendencies) you can get an approximate idea of where the plant came from. It is used in archeology to trace trading routes of plant materials, and sometimes is used in law enforcement to figure out where plants-of-interest were grown.
Example: Where Do Hot Springs Get Water? • Is the water in hot springs heated rainwater, water coming from the mantle, or something else? This graph of 2H vs 18O has been interpreted as follows. • The hydrothermal waters don't all have the same (18O,2H) coordinate, or converge towards a particular coordinate, so the waters probably don't come with the magma from the mantle. • Each trajectory (dotted lines) includes the rainwater coordinates for that location, suggesting that rainwater (meteoric water, solid line) is involved, but that it isn't the only thing. • The final explanation is that the hydrothermal water starts as rainwater, and has partially equilibrated with the oxygen in the country rocks (which have high 18O values), so that the 18O varies depending on how much the water has interacted with the country rock, giving the departures to the right.
Where Does Floodwater Come From? • This shows measurement of 18O in stream discharge during a rainfall and consequent storm surge event. The investigator is trying to determine the contributions directly from the rainfall versus from water stored as groundwater. • By knowing the isotopic composition of "normal" groundwater and of the rainwater and acquiring a sequence of measurements during the flood, he showed that • around the storm peak, rainwater makes a significant but not overwhelming contribution of water • the rainfall mainly produces an increase in flow by pushing water already in groundwater further along
Example: Paleo-Temperatures 1 One of the most interesting, and easily botched or over-interpreted, uses of isotope geology is estimating past temperatures based on isotopic evidence. It's very easy to do this wrong by relying on single measurements without consideration of normal variation and possible other causes of variation, and especially by using only a single phase (water in ice, calcite in shells) without having control on the source. This graph is isotopic composition vs. depth (both measured) with dates labeled (by counting bands) for an ice core at Scott Base in the Antarctic. • Compare the thickness of ice accumulated in 1960/1961 to that accumulated in 1961/1962: the accumulation rates vary dramatically even from year to year, so converting ParameterA vs depth into ParameterA vs time is not easy nor likely to be accurate. • There is a wide variation of δ18O values within a year, so that it's not really accurate to say "this value of δ18O indicates that the annual global temperature year 721BP was X"
Example: Paleo-Temperatures 2 • This pair of graphs originated as d18O vs depth and were converted into d18O vs time. The large negative excursion from 12,000 BP (before present) to 70,000BP is the most recent ice age (the Wisconsin). Before that, during the previous inter-glacial (we're in an inter-glacial period now.) the 18O values were higher, suggesting temperatures higher than present. • The last ice age started slowly but ended very quickly, or maybe the ice is getting smeared out (the top part of the core shows lots of spikey deviations compared to the bottom part, which shows more gradual deviations, which suggests that time could be acting as a smoothing process, by mixing, for instance.) [Other ice cores and sediment cores also suggest slow beginnings and fast endings to ice ages.] • Values hover around one of two dominant values (one for ice ages, one for inter-glacials) for each location. This means that it's not quite as simple as "there was ONE ice age from 12 to 70 kA BP", but rather that there was much variation even during the glacial and inter-glacial times. [Lots of other well logs show this tendency for excursions around one of two main values, suggesting dynamic equilibrium around two (or a few) modes.] • The idea that there is a constant temperature from year to year or century to century is not well supported by geological evidence.
Further Reading These are interesting, but might be too advanced. • This http://www.geo.cornell.edu/geology/classes/Geo656/656notes03/656%2003Lecture26.pdf is a surprisingly readable explanation of stable isotope geology • This http://www.uvm.edu/~cmehrten/courses/earthhist/paleoclimind.ppt is a lecture on Paleoclimate Indicators • Here http://www.mmm.ucar.edu/events/antarctic06/presentations/schlosser.ppt is a cool presentation that acknowledges the problems of converting delta-18O into temperature.