Download
1 / 19
190 likes | 218 Vues
Controlled assessment. High level presentation made easy!. Accuracy and completeness. The course requirements. Types of more complex presentation skills that students could use to access Level 3

E N D
Controlled assessment High level presentation made easy!
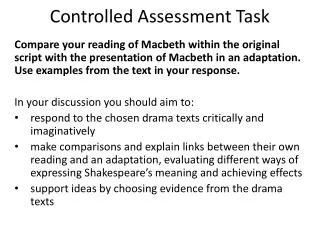
The course requirements • Types of more complex presentation skills that students could use to access Level 3 • The skill itself is just part of the requirement. Completeness, accuracy and appropriateness must also be assessed. Presentation skills that have been used at Level 3 in the past include: • cross sections (do not exaggerate scales) • proportional flow line maps • isoline maps • choropleth maps • proportional flow line maps • proportional symbols located on to base maps • some statistical techniques (all working shown) • scatter graphs • very well annotated photographs and field sketches.
Presentation at an advanced level • … is all about information and interpretation, and location • Graphs do not necessarily speak for themselves • Data in geography is always locational – it depends on where it is (that’s the geographical part of it!)
Advanced presentation • Annotation of maps/images • Easy! • Make your comments relevant and highly descriptive • Opportunity to interpret • Opportunity to evaluate • Some examples:
Complex? High level of congestion found here during rush hour times Traffic lights here have negligible effect on congestion on lower part of road
Complex? Extensive parking for customers: they can visit more than one major retailer in one visit Limited parking for patrons: just a stop and drop visit!
Inventive bar charts • Multiple data sets? • You can go from this…
Land use map? Good to show clustering of activity e.g. retail • Shade in each plot to represent the land use • Good for developing patterns • But don’t forget the conventions…
Other map types • Choropleth maps – could represent environmental quality survey scores for a range of areas • Dot maps: frequency or location of a variable e.g. litter across a park
Flowline • Arrows represent size of flow e.g. traffic count or pedestrian count • 2pm on Saturday • What can you see? Why? • Example key • =10 cars
Desire line • Great for assessing the popularity or geographic reach of a function or place • Work out the market area by taking an average of the distances – becomes the radius of the ring around the function
Other types of graph • Kite chart: how does this work? • Star diagram
Some statistical techniques • Spearman’s rank • Tests the strength of a relationship between two variables • Chi Squared • measures how well the observed data matches up to what we would expect
Google up your assessment! • From measuring distance to presenting desire lines, you can quite easily use Google Earth. • Click here for a link to some great creative ideas on how to present your data Desire lines shown on Google Earth