Materials and Methods
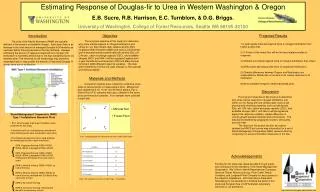
Estimating Response of Douglas-fir to Urea in Western Washington & Oregon E.B. Sucre, R.B. Harrison, E.C. Turnblom, & D.G. Briggs. University of Washington, College of Forest Resources, Seattle WA 98195-32100. Introduction. Objective. Projected Results.

Materials and Methods
E N D
Presentation Transcript
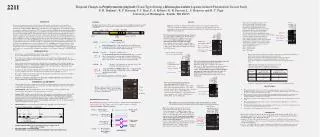
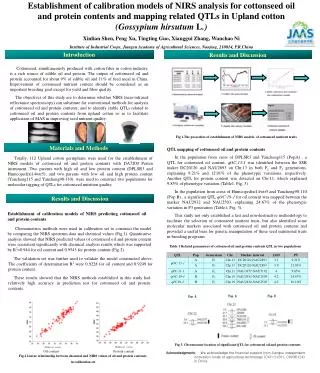
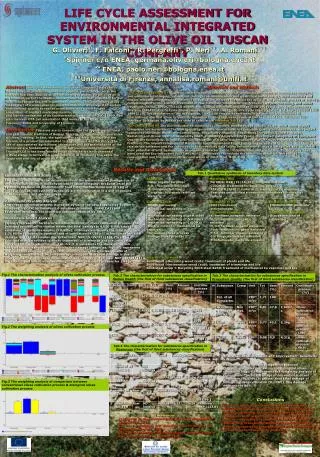
Estimating Response of Douglas-fir to Urea in Western Washington & Oregon E.B. Sucre, R.B. Harrison, E.C. Turnblom, & D.G. Briggs. University of Washington, College of Forest Resources, Seattle WA 98195-32100 Introduction Objective Projected Results The soils of the Pacific Northwest (PNW) are typically deficient in the amount of available nitrogen. Each year there is an increase in the total amount of managed Douglas-fir [Pseudotsuga menziesii (Mirb) Franco] plantations that are fertilized. However, estimating the amount of response expected from nitrogen (N) fertilization is extremely difficult due to the high variability that exists between sites. The influence of soil morphology may provide a meaningful way to help predict the amount of response Douglas-fir stands have due to fertilization. The long term objective of this study is to determine why some stands respond to nitrogen fertilization and others do not. Site climatic data, relative density (RD), Quadratic Mean Diameter (QMD) and various soil physical and chemical properties specifically bulk density (Db), pH, C/N ratio, cation exchange capacity (CEC), and available nitrogen (NO3- and NH4+) will be regressed against both 4-year Periodic Annual Increment (PAI) and Mean Annual Increment (MAI) different response variables. The data were stratified by soil textural class (Glacial vs. Non-glacial) and thinning regime. 1) Lower quality sites will respond more to nitrogen fertilization than higher quality sites. 2) C:N ratio of the forest floor will be the best related variable to response. 3) Different soil orders respond more to nitrogen fertilization than others. 4) ISPA/2 plots will respond the most to repeated N fertilization. 5) Climatic differences between Oregon and Washington are responsible for differences in the amount of volume response to N fertilization. 6) More available nitrogen in fertilized treated plots. Materials and Methods Composite samples were created by combining cores taken at several points in measurement plots. Mineral soil was sampled at 0-15, 15-30, and 30-50cm depths (Fig 1). Forest Floor (F.F.) samples were also collected in the same plots as mineral soil samples. Four samples were collected in each plot. Discussion The long term objective of this study is to determine why some stands respond to nitrogen fertilization and others do not. Along with site climatic data, various soil physical and chemical properties such as bulk density (Db), pH, C/N ratio, cation exchange capacity (CEC), and available nitrogen (NO3- and NH4+) will be regressed against the response variable ( relative difference in volume growth between fertilized and control plots). The data will be stratified by geographic location, site quality, and soil order. The data from this project will also be used to validate the NRCS soil survey map information for a set of Stand Management Cooperative (SMC) research sites by comparing it to actual information measured on the site. • Stand Management Cooperative (SMC) Type 1 Installations Research Plots • Six 1 acre Douglas-fir plots per installation were examined for this study. • 3 fertilized and 3 non-fertilized plots with different initial stocking levels were compared to each other. • The following comparisons were made between the following plots with in each installation: • ISPA, Repeated thinning: RD55->RD35, RD55->RD40, subsequent RD60->RD40 • ISPA, Repeated thinning: RD55->RD35, RD55->RD40, subsequent RD60->RD40, fertilized with 200 lbs/ac N as urea every 4 years • ISPA/2, Minimal thinning: RD55->RD35, no further thinning • ISPA/2, Minimal thinning: RD55->RD35, no further thinning, fertilized with 200 lbs/ac N as urea every 4 years • ISPA/4, No further thinning • ISPA/4, No further thinning, fertilized 200 lbs/ac N as urea every 4 years Fig 1- Sampling points for soil and forest floor in SMC Type 1 plots. { Acknowledgements Funding for this study was made possible through grants and contributions from members of the Stand Management Cooperative. We’ d like to thank Weyerhaeuser Company, Hancock Timber Resource Group, Plum Creek Timber Company, and Longview Fibre Company for easy access to the research installations. We’d also like to thank Bert Hasselberg for his assistance in locating the plots for this study and Dongsen Xue of UW Analytical Laboratory Services for his assistance. { Fig 2- Soil suborders and SI50 for SMC Type 1 Installations { http://www.cfr.washington.edu/research.smc/