Framework for Phase 2 Modeling
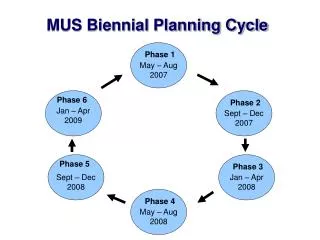
This framework outlines the Phase 2 modeling function for exploring alternative growth scenarios in Metro Boston, focusing on five key study areas: People and Communities, Getting Around, Buildings and Landscapes, Air, Water and Wildlife, and Prosperity. The process integrates qualitative and quantitative narratives, employing computer models and community visualization tools. Various approaches (inductive, deductive, and incremental) will be utilized to build scenarios and assess regional population projections, demographic trends, and municipal employment dynamics over time.


Framework for Phase 2 Modeling
E N D
Presentation Transcript
Framework for Phase 2 Modeling Function of the Model: A platform for discussing alternative growth scenarios in Metro Boston and the associated tradeoffs Five Study Areas: People and Communities Getting Around Buildings and Landscapes Air, Water and Wildlife Prosperity
Phase 2: Baseline Model • Narrative: • Qualitative Narrative • Quantitative Narrative • Computer Model: Community Viz • 15-25 Components • 7-15 Components • 3-6 • Components
Scenarios Agents • Steering Committee • Inter Issue Taskforce • Technical and Content Liaison • Consultant Team • Public and Leadership Dialogues
Three Ways to Build Scenarios • Inductive Approach-Data driven framework • Deductive Approach- Start with framework and fill in data • Incremental Approach- Start with “Official Future” fill in framework and data
Regional Population Projection November 2005 MAPC
1990 Population by Cohort (Age, Sex, Race) Death Rates Birth Rates Future Natural Increase 2000 Population by Cohort Regional Population Projection Difference = Migration by Cohort Apply Migration Rates Future Migration Future Regional Population (Regional Control) Trend of Municipal Total Share Future Municipal Total Population Municipal Population Location Trend of Municipal Share by Age Future Municipal Population by Age
Cohort-Component Method Birth Migration Base Year Population Projected Year Population Survival MAPC August 10, 2005
Cohort-Component Method Birth Migration Birth Rate Net Migration Rate Child Bearing Cohorts New Births Base Year Population Projected Year Population Survived & Aged Population Net Remaining Population = Every Cohort Survival Rate Survival MAPC August 10, 2005
Survival Rate and Aging • Age-sex-race specific survival rate • As of year 2000
1990 Population by Cohort (Age, Sex, Race) Death Rates Birth Rates Future Natural Increase 2000 Population by Cohort Regional Population Projection Difference = Migration by Cohort Apply Migration Rates Future Migration Future Regional Population (Regional Control) Trend of Municipal Total Share Future Municipal Total Population Municipal Population Location Trend of Municipal Share by Age Future Municipal Population by Age
Calibration based on Year 2000 * Calibration shifts up or down the line to pass through the data of year 2000.
Regional Employment Projection National Employment Total Trend of Regional Total Share Regional Employment Total Trend of Regional Sector Share Regional Employment By Sector Municipal Employment Location Trend of Municipal Total Share Total Municipal Employment Trend of Municipal Sectoral Share Municipal Employment By Sector
Shift-Share & Two-waySectoral Projection National Total Employment 1982-2004
Shift-Share & Two-waySectoral Projection Regional Share of National Employment 1990-2004
Shift-Share & Two-waySectoral Projection Regional Employment Total Regional Share National Employment Total Regional Employment Total
Shift-Share & Two-waySectoral Projection National Structural Change 1982-2004 Manufacturing (Down: 20 % to 12 %) Professional Service (Up: 8.5 % to 12 %) Education & Health (Up: 8 % to 12 %) Government (Down: 18 % to 16 %)
Shift-Share & Two-waySectoral Projection Regional Variation of Structure 1990-2004 Manufacturing (Down: -0.2 % to -1.4 %) Professional Service (Up: 2.6 % to 3.4 %) Education & Health (Down: -6 % to -5 %) Government (Down: -4 % to -4.2 %)
Regional Employment Projection National Employment Total Trend of Regional Total Share Regional Employment Total Trend of Regional Sector Share Regional Employment By Sector Municipal Employment Location Trend of Municipal Total Share Total Municipal Employment Trend of Municipal Sectoral Share Municipal Employment By Sector
Land Use ModelAllocation to Traffic Analysis Zones November 2005 MAPC
Land Use ModelAllocation to Traffic Analysis Zones Population/Housing Units • Three components of Housing Unit Growth • Greenfield Development • Densification • Community Comments • Housing unit estimates are scaled to meet the projected housing unit demand, based on population and household size.
Land Use ModelHousing Unit Development Greenfield Development • Rate of new residential land is based on land consumption rate from 1971-1999. • Buildable land excludes permanently protected open space, wetlands, commercial/industrial zones, and built land. • Housing development occurs at the density allowed by underlying zoning, with a 10% discount for roads and unbuildable areas. • Not more than 80% of remaining buildable units can be constructed in any one decade.
Land Use ModelHousing Unit Development Densification • “Densification Factor” calculated for each community, based on increase in housing units per acre of developed land, 1970-2000. • Multiplied by the square of the Buildout Factor so that densification is focused in those TAZs that are closer to buildout. • Multiplied by the amount of developed land to yield number of densification units.
Land Use ModelHousing Unit Development Community Comments • Some community comments indicated specific numbers of units for specific TAZs. • Where a range was given, MAPC usually used the low end of the range and paced multi-decade developments conservatively. • If specific numbers of units were not indicated, substituted 5% of total housing unit demand.
Land Use ModelHousing Unit Development Scaling • Preliminary housing unit projections (Greenfield and Densification) were summed across all TAZs in community. • Community Comment units not subject to scaling. • (Total HU demand – community comment units) ÷ preliminary housing unit projections = scale factor. • Scale factor applied to preliminary HU projections for each TAZ; add community comment units to yield Adjusted Total Housing Units. • Adjusted Total Housing Units assumed to have the same Greenfield-Densification proportions as Preliminary HU projections.
Land Use ModelHousing Unit Development Community Comment Units Housing Unit Demand Adjusted Housing Unit Total “Preliminary Housing Units" 40% 40% Densification Units 60% 60% Greenfield Units
Land Use ModelEconomic Development TAZ-level Employment Projections • Rate of new commercial/industrial/urban open land is based on land conversion rate 1985-1999. • Buildable land excludes wetlands, protected open space, residential zones, built areas. Discounted by 10% to allow for roads and unbuildable areas. • Job Densification factor: increase in employees per acre of commercial/industrial/urban open land per decade. • Initial total employment is a function of Total C/I/UO land times new Job Density.
Land Use ModelEconomic Development Sectoral Allocations • Initial total employment is multiplied by previous decade’s sectoral proportions to yield initial sectoral employment. • Initial sectoral employment summed across all TAZ’s and compared to projected community-level sectoral employment to yield a scale factor. • Initial sectoral employment scaled accordingly. • Adjusted employment for all sectors summed to yield adjusted total employment for TAZ.