Download
1 / 22
250 likes | 482 Vues
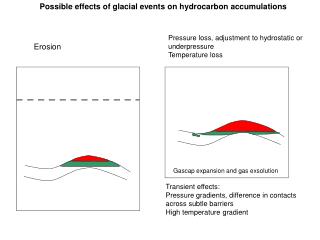
Possible effects of glacial events on hydrocarbon accumulations. Pressure loss, adjustment to hydrostatic or underpressure Temperature loss. Erosion. Gascap expansion and gas exsolution. Transient effects: Pressure gradients, difference in contacts across subtle barriers

E N D
Possible effects of glacial events on hydrocarbon accumulations Pressure loss, adjustment to hydrostatic or underpressure Temperature loss Erosion Gascap expansion and gas exsolution Transient effects: Pressure gradients, difference in contacts across subtle barriers High temperature gradient
0 1 2 1000 2000 3000 Dyp i meter Volumøkning av gassekspansjon, 1500 m erosjon Barents Sea: Cooling commonly results in net leakage of gas from traps Residual oil
Ice cover and cold periods Low temperature Possible permafrost and gas hydrates Possible pressure build-up Possible stress change Transient low temperature Hydrostatic pressure increase Possible gas hydrates Possible pressure build-up Transient slightly lower temperature ?
Residual oil in gas Residual oil in water Tilting of oil – gas accumulation E W Vol gas = constant Vol oil = constant When the field is tilted, the gas and oil will adjust to the new trap volume. If there is no migration, leakage or pressure change, the volume is preserved. When oil is swept by gas or water, some residual oil is left. Gas sweeps oil more efficiently than water, so oil shows in the gas zone are expected to be weaker than in the water.The paleo-contact reveals the position of the original contact. However, the paleocontact is not necessarily of the same age everywhere.
Snøhvit Albatross Askeladd Goliat 1000 1500 2000 2500 Sketch profile of Hammerfest Basin Fields
Fast migration and spill of hydrocarbons: The impact of Plio-Pleistocene history on oil zones and residual oil in the Troll Field Janka Rom Wenche Tjelta Johansen Trond Brekke (Brekke Chemo) Fridtjof Riis
Troll field 35x55 km, Located in the glacially eroded Norwegian channel (Norskerenna), 50 km from the coast Belongs to the rim zone of Scandinavia which was affected by Cenozoic uplift Bergen Stavanger
Troll: Tectonic setting and migration routes 2km 1km tilting GNSR-119A erosion 500 ms Troll Viking Graben 20 km migration
TROLL EAST Gas, 0 – 6 m oil Southern connection TROLL WEST Gas province, 13-14 m oil Middle connection Northern connection TROLL WEST Oil province, 22-27 m oil
Biodegradation 2.0 1.2 1.2 2.2 Sognefjd. and oil) 1.5 (Water zone) 5.3 4.0 (Sognefj.) 1.1 - 2.7 1.7 0.6 4.9 4.6 3.8 2.3 0.3 1.7 – 3.0 0.5 0.3 – 0.6 0.9 - 1.7 1.9 (oil) 9.0 (oil) 2.5 1.5 (water zone) 0.5 – 1.1 19.0 (oil) 0.7 (Sognefjd.) 2.0 (oil) 0.3 –0.4 0.1 – 0.3 1.10- 1.8 3.5 (Sognefjd.) 2.3 (oil) 5.5 – 14.4 (Water zone 0.1 %CO2 in gas Pr/n-C17 Oil and residual oil: strong biodegradation in the W, weak in the east
Temperature from DST Biodegradation is observed in shallow North Sea fields, limited to approx 1700 m below sea floor Less biodegradation in Troll East than Troll west – supports a deeper initial burial of Troll East
Troll Paleo oil Well observations: thickness of residual oil below oil zone 1550 ? 1600 ? 0 50 mg/g EOM Residual oil and paleo contacts in wells EOM data from Horstad et al. ,
W E 4D seismic effect (1991-2005) Water saturation profile Low water saturations - orange colours. Residual oil zone - purple colour. Smoothed time thickness map of the difference between the black and the red reflector. Reflects thickness of paleo oil zone
STOIIP in paleo oil zone, assuming average Sw = 0,2 TWOP: 125 mill Sm3 Total: 423 mill Sm3 Troll Paleo oil Map of Troll showing depth of conceptual paleo oil water contact
Residual oil in gas Residual oil in water Tilting of oil – gas accumulation E W Vol gas = constant Vol oil = constant When the field is tilted, the gas and oil will adjust to the new trap volume. If there is no migration, leakage or pressure change, the volume is preserved. When oil is swept by gas or water, some residual oil is left. Gas sweeps oil more efficiently than water, so oil shows in the gas zone are expected to be weaker than in the water.The paleo-contact reveals the position of the original contact. However, the paleocontact is not necessarily of the same age everywhere.
120 m 500 m 250 m 60 m 300 m 180 m Tilting of Troll The animation starts with present day and geometrically tilts the structure back to 500 m tilt. (Mid Miocene?) Reference level (grey horisontal surface) is based on the spill in the northern connection Top Sognefjord present
Holocene tilt Isobases at the end of the Weichselian glaciation 20 m contours
Submerged beach Younger Dryas isobases
Glaciation – tilting combined with pressure effects Glacial load Eustatic fall 100 m lowering of eustatic sea level: 10 bar pressure reduction Troll example: 7 % gas cap expansion 4-5 m deeper gas oil contact Ice stream in Norwegian channel 300 m higher than present sea level: 28 bar pressure increase Troll example: 15 % gas cap contraction 10 m shallower gas oil contact
Glaciation effects on contact movements WEST EAST Eustatic fall 4-5 m down Max 15 m up Eustatic fall 4-5 m down Max 25 m down Glacial load 10 m up Max 30 m up Glacial load 10 m up Max 10 m down 40 m tilt
180 m 300 m Timing of events Examples of possible uplift curves First spill into Troll East Between 180 and 300 m tilt Between 1,8 and 7,2 Ma Between 1,2 and 4,4 Ma
Conclusions • The paleo oil water contact in Troll was formed in the Neogene, probably prior to the Pleistocene and later than 6 Ma. • At this time the field was tilted between 180 m and 300 m, and the gas volume was less than 60 % of the present volume. The corresponding rate of gas migration is in the order of 0,2 Mm3/year • Glacial effects are not big enough to explain the paleo oil water contact • In the western part of Troll, the oil zone may have been 20 – 25 m deeper in the Weichselian • Oil shows in the gas zone mainly occur in the eastern part of Troll West, and were most likely formed during the Neogene tilt. A further study of these oil shows could give information about the thickness of the ice stream.