Fall 2004 Baruch College Undergraduate Statistics
A summary of undergraduate statistics at Baruch College for Fall 2004, including data on enrollment, faculty, admissions, and expenses. The report covers aspects such as student demographics, enrollment numbers, faculty composition, tuition costs, and more.

Fall 2004 Baruch College Undergraduate Statistics
E N D
Presentation Transcript
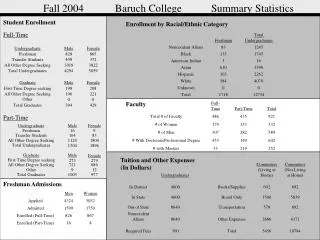
Fall 2004 Baruch College Summary Statistics Undergraduate Undergraduates Men Women Freshman Full-Time Commuters (Living at Home) Part-Time Commuters (Not Living at Home) Total Undergraduates Total Male Female Freshman 16 9 Applied Total # of Faculty Nonresident Aliens 4324 5032 83 486 435 1245 921 Transfer Students 164 83 Black 135 1745 In District 4000 Books/Supplies 692 692 Admitted # of Women 1599 1750 179 153 332 Undergraduate Male Female All Other Degree Seeking 1124 1304 1804 1896 American Indian 3 16 # of Men Enrolled (Full-Time) Freshman 826 867 307 282 828 448 589 865 In State 4000 Board Only 1500 5039 Total Undergraduates Asian 610 3396 Transfer Students 372 Enrolled (Part-Time) # With Doctorate/Professional Degree 16 8 453 149 602 Out of State 8640 Transportation 578 692 Female Hispanic 303 2262 All Other Degree Seeking 3018 3822 # with Masters 33 219 252 Nonresident Aliens 8640 Other Expenses 2686 4371 Graduate White 584 4070 Male 273 279 Total Undergraduates 4294 5059 Required Fees 300 Total 5456 10794 First Time Degree seeking Unknown 0 0 All Other Degree Seeking Total 1718 12734 721 686 Graduate Male Female Other 9 12 First Time Degree seeking 198 208 Total Graduates 1003 977 All Other Degree Seeking Other 196 221 0 0 Total Graduates 394 429 Student Enrollment Enrollment by Racial/Ethnic Category Full-Time Faculty Part-Time Tuition and Other Expenses (In Dollars) Freshman Admissions