Download
1 / 40
400 likes | 490 Vues
Explore the essential factors influencing Health Informatics such as Big Data, Genomics, Interoperability, and Meaningful Use for improved population health and healthcare delivery systems. Learn about the evolution of information and the drive towards a Learning Health System.

E N D
Key Driving Forces in Health Informatics W. Ed Hammond. Ph.D., FACMI, FAIMBE, FIMIA, FHL7Director, Duke Center for Health InformaticsDirector, Applied Informatics Research, DHTSAssociate Director, Biomedical Informatics Core, DTMIProfessor, Department of Community and Family MedicineProfessor Emeritus, Department of Biomedical EngineeringAdjunct Professor, Fuqua School of BusinessDuke University Chair Emeritus and Secretary, HL7
Information is what our world runs on. Man has evolved from the food-gatherer to the information gatherer. Information pervades science from top to bottom, transforming every branch of knowledge. Marshall McLuhan, 1967
Our age is the Information Age – younger than some of us. Claude Shannon created that age in 1948 when he made information a science; he gave it a definition; he gave it units of measurement – the bit. Shannon estimated the digital information in a text, a photograph, a record, and even in the Library of Congress.
What are the Driving Forces? • Meaningful Use • Big Data • Health Analytics • Learning Health System • Genomics • Translational Medicine • Interoperability • Shared Data
Shared Data Patient Reported Outcomes Aggregated Patient-centric Genomic Learning Health System Biomarkers Interoperability Clinical Health Analytics EHR Big Data GIS Clinical Trials Environmental Meaningful Use Images Translational Medicine
Meaningful Use • In 2008, the National Priorities Partnership, convened by the National Quality Forum (NQF), released a report entitled “National Priorities and Goals” which identified a set of national priorities to help focus performance improvement efforts. • Among these priorities were patient engagement, reduction of racial disparities, improved safety, increased efficiency, coordination of care, and improved population health. • These priorities have been used to create the framework for “Meaningful Use” of an electronic health record system • The ultimate goal of Meaningful Use of an Electronic Health Record is to enable significant and measurable improvements in population health through a transformed health care delivery system
Implementation Incentives • Entering orders, medications, etc. in CPOE • Maintaining problem lists in ICD9-CM/ICD10-CM or SNOMED CT® coding • Maintain active medication list and electronic prescribing • Recording vital signs, smoking status • Receive and display lab results encoded with LOINC codes • Generate patient lists based on specific conditions and generate patient reminders
Implementation Incentives • Provide patients with electronic copy and electronic access to their record and discharge instructions • Generate a clinical summary for each visit • Exchange clinical data with other providers • Protect the information, encrypt it and record disclosures
Learning Health System • Digital health data is essential for a continuous learning health system. • Necessary to coordinate and monitor patient care, analyze and improve systems of care, conduct research to develop new products and approaches, assess the effectiveness of medical interventions, and advance population health. • Goal of IOM project is by year 2020, 90% of clinical decisions will be supported by accurate, timely, complete, reliable, trusted, and will reflect the best evidence available,
Big data • EHR growth • from bytes to kilobytes to megabytes to gigabytes to terabytes to petabytes to exabytes to zettabytes to yettabytes to … • Less is more • Filters that are purpose and event driven • New methods of presentation • Overload and fatigue • Awareness
1950s – 600 Megabytes In the 1950s, insurance companies had the biggest data hoards as they collected and stored data about policy holders. John Hancock Mutual Life Insurance Company was one of the pioneers in digitizing customer information, storing data from two million life-insurance policies on a Univac computing system acquired in 1955. Source: Wall Street Journal March 2013
1960s – 807 Megabytes In the 1960s, American Airlines developed Sabre, a flight reservation system built around one of the largest IBM computing systems available. Sabre was one of the first on-line computing systems, allowing the airline to keep track of an immense matrix of reservations, flight schedules and seat inventories. Source: Wall Street Journal March 2013
1970s – 80 Gigabytes FedEx’s Cosmos system, introduced in the q970s , allowed the company to scan and track its huge volume of packages being shipped around the world. Source: Wall Street Journal March 2013
1980s – 450 Gigabytes In the 1980s, banks were at the forefront of data growth, with ATMs coming into vogue and banks focusing on collecting and analyzing transaction data for all their businesses. An example is CitiCorp’s NAIB. Source: Wall Street Journal March 2013
1990s – 180 Terabytes Wal-Mart in this decade became the largest American bricks and mortar retail operation, and, it is believed, had the biggest commercial data warehouse in the world. To put this number in perspective, experts have estimated that Amazon.com in the late 1990s had single-digit terabytes of stored data. Source: Wall Street Journal March 2013
2000s – 25 Petabytes The explosion of the Internet in the ‘90s set the stage for Web-based companies such as Google to emerge in the following decade as the global leaders in big data. Source: Wall Street Journal March 2013
2010s – 100 Petabytes Is Facebook’s data hoard bigger than Google’s today? Some say yes, some say no. According to Facebook, its user content makes up more than 100 petabytes of stored photos and video. And analyzing that data generates about 500 terabytes of new information every day – more than 2 ½ times the size of a ‘90s Wal-Mart data cache. Source: Wall Street Journal March 2013
The Growth of Big Data Global data is growing at rate of 59% per year
2004 to 2012:BI, Analytics, and Big Data Analytics Business Intelligence Google Trends K Search Big Data
Challenges of Big Data • Volume – traditional computers with relational data bases are not capable of handling data of significant volume – Exabyte’s 100s of terabytes • Velocity– data flowing into organizations is coming in very fast, users are demanding live streams of data • Variety– there are many kinds of data now including photos video, audio, 3d models, simulations, location data
Topics in Analytics • Statistical Programming • Data Mining • Advanced Modeling • Linear Regression • Logistic Regression • ANOVA • Time Series • Forecasting • Survival Analysis • Text Mining • Financial Analytics • Risk Analytics • Customer Analytics • Fraud Detection • Geospatial Analytics • Linear Programming • Optimization • Data Visualization
From molecules to population MolecularBiology ClinicalResearch Patient Care Public Health Population Health Translational Medicine T1 – T4 Individual, Family, Community, Societies Site of Care: Intensive care, inpatient, ambulatory, intensive care, emergency department, long term care, home care Clinical Specialties Global
Genetics • Gene mutation will identify many treatable genes such as Hirschsprung’s disease, muscular dystrophy, and cystic fibrosis • Drug treatments are already influenced by genomic information • The anticoagulant drug warfarin has a narrow therapeutic window - too high a dose, patient can bleed to death; too low a dose, clots remain unclotted. Genetic information [certain versions of two genes CYP2C9 and VKORC1] are highly predictive of rate of metabolizing warfarin.
Clinical Research Informatics • Registries, controlled data exchange among researchers, provenance, data capture tools such as REDCap, query tools such as i2b2, analytics tools, management of clinical trials • Patient care – continuing use of patient care data, shared collection of data, cohort identification, discovery of target drug requirements, early translation of research into routine patient care • Population Health – understanding of prevalence of disease, identification of new drug targets
Patient Care Informatics • Meaningful use of data, EHR systems, data exchange, decision support, supporting safe and high quality health care effectively and efficiently at best cost, interoperability among all sites of care, embracing preventive and personalized care, clinical data warehouses, creation of new knowledge, supporting patient-centric EHRs • Adverse events fed back to clinical research and ‘omics research
Public Health Informatics • Acquisition of data and structured reports, tracking of disease outbreaks, control of epidemics, insuring appropriate immunization and vaccinations, analytics, infectious disease control, disaster management • Patient care – source of data from health surveillance and disease management
EHR • New types of data • Genomic • Image • Waveform • Patient-generated • Video • Environmental • Behavioral • Within the next 5 years, over 50% of the data contained in a patient’s EHR will be non-clinical.
Predictions for the next decade • We will discover a genetic linkage to most diseases • Early discovery of disease-causing mutations will influence care with better outcomes • Cost of DNA sequencing will drop to $500 or less • Children will have their DNA sequenced at birth • Most adults will have their DNA sequenced • Genomic data coupled with personal health data will have a strong impact on the pharmaceutical industry. Drugs will be more targeted. • Health care model will change as will the role of the provider
Challenges • Acceptance that cooperation and sharing is a win-win situation • Single ontology that links all domains; that is an open process; that uses a common process in which expertise is the dominant factor; identifies stewardship of each ontological term • Ontology removes all ambiguity in associated attributes; ontology matches terms that are used in the process of research and care
Challenges • Solves privacy issues; recognizes that personal control of data may harm creation of new knowledge and seamlessly connecting the contributing domains for the most effective care • Identification and implementation of standards for data and data exchange • Controlled and purposeful exchange of data • Quality of data is insured through process, algorithms, and certainty factor
So, what can we do? • Facilitate appropriate use of technology for health care (Meaningful Use) • Improve the ability to make appropriate decisions about diagnoses and treatments (MU) • Improve the knowledge base for health care • Eliminate inefficiencies in the process of administration and in health care delivery • Create new models for delivery, administration, and reimbursement of care
More of what can we do • Evaluate the effectiveness of testing and treatment (Comparative Effectiveness Research) • Improve techniques for the management and use of data (MU) • Educate people in the need for and use of informatics (HITECH, incentive funding) • Ethics, privacy, security (HIPAA)
What is GIS? • A geographic information system (GIS) integrates hardware, software, and data for capturing, managing, analyzing, and displaying all forms of geographically referenced information. • GIS allows us to view, understand, question, interpret, and visualize data in many ways that reveal relationships, patterns, and trends in the form of maps, reports, and charts. • Ultimately helps answer questions and solve problems by allowing us to look at our data in a way that is quickly understood and easily shared. Source: Sohayla Pruitt
GIS Core Capabilities: Visualization Source: Sohayla Pruitt
What I did not talk about • Mobile devices • Data Elements • Phenotypes • Personalized Medicine • Consumer Engagement • Social Networking • 3D Printing • Virtual Reality
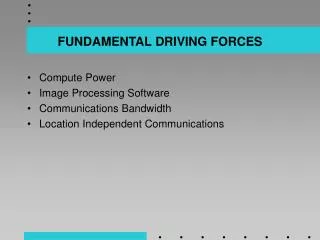
What has technology added? • Moore’s Law – faster, bigger, cheaper computers and communications than ever • Wireless, global communication that instantly connects the world • Small, mobile devices that are ubiquitous • More knowledge than we can use • The ability to aggregate all data about a person from all sources • A rich mixture of media to enhance our understanding of disease and its cure
Conclusion / Summary • The pace of technology has been paced by Moore’s law: roughly, computational power doubles approximately every two years • Use of technology – informatics – has not kept pace. The future of health care depends on our getting ahead of the curve • That step demands a step change – revolution, not evolution!