Download
1 / 53
530 likes | 536 Vues
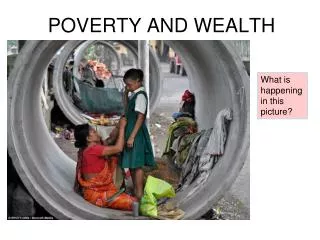
Poverty and Wealth David Gordon Bristol Poverty Institute University of Bristol 13th March 2018 Dartington Service Design Lab Centre for Social Policy Dartington Hall. The Problem of Riches.

E N D
Poverty and Wealth David Gordon Bristol Poverty Institute University of Bristol 13th March 2018 Dartington Service Design Lab Centre for Social Policy Dartington Hall
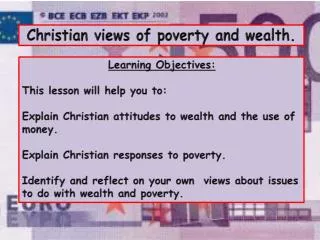
The Problem of Riches “what thoughtful rich people call the problem of poverty, thoughtful poor people call with equal justice a problem of riches” Tawney, R. (1913, p10) Poverty as an industrial problem, inaugural lecture, reproduced in Memoranda on the Problems of Poverty, London: William Morris Press.
Poverty is not a Behaviour Since the work of Charles Booth (1902-03), Seebohm Rowntree (1901) and their Victorian and Edwardian contemporaries (e.g. Webb & Webb, 1909) repeated studies have shown that the primary cause of poverty is not the ‘bad’ behaviour of the poor. Poverty in the UK is primarily caused by structural factors, such as low wages, a lack of jobs, the lack of state provision to adequately compensate those engaged in unpaid work – particularly caring work, etc. Despite intensive research by often highly partisan researchers, as far as I am aware there are no credible scientific studies which show that any significant group of people are poor as a result of indolent, feckless, skiving or criminal behaviour.
The Underclass is a Persistent Myth The fruitless search for the underclass is the Hunting of the Snark of UK social science research. Over a 100 years of searching has failed to discover any significant group which could be identified as an underclass. The name attributed to this group has changed over time from the Victorian residuum, the unemployables of the Edwardian era, the Social Problem Groups of the 1930’s depression era, the Problem Families of the 1940s, the culture of poverty and cycle of deprivation of the 1960s and 70s, the underclass of the 1980s and 1990s to the Troubled Families of the present day (Blacker, 1937, 1952; Welshman, 2013). More research monies and effort have probably been wasted searching for the underclass than in any other area of UK Social Science research. However, no British study has ever found anything but a small number of individuals whose poverty could be ascribed to fecklessness or a ‘culture/genetics of poverty/dependency’ (Gordon and Pantazis, 1997).
Poverty and Wealth • Cannot explain poverty in isolation of the distribution of all resources in society. • There can be no understanding of poverty in a society without studying the rich. • Townsend continually emphasised that poverty was fundamentally ‘a problem of riches’ and argued for profound changes in the structures of power and privilege: “The institutions which create or disadvantage the poor at the same time as they create or advantage the rich are institutions which have to be reconstructed “(1988:59).
Origins of Inequality: Grand Theory Ian Morris: Evolution of Human Values Ian Morris: Ideal Type Moral Values by Society
Grand Theory: Kuznets Curves and Tocqueville’s Nobel Savages The Kuznets hypothesis (circa1955), argues that inequality charts an inverted U shape (as an economy changes from farming to industrialized). Kuznets argued that: One might thus assume a long swing in the inequality characterizing the secular income structure: widening in the early phases of economic growth when the transition from the preindustrial civilization was most rapid, becoming stabilized for a while; and then narrowing in the later phases. (Kuznets, 1955, p. 276) This was not an original idea it had been set out 120 years earlier by Alexis de Tocqueville: If one looks closely at what has happened to the world since the beginning of society, it is easy to see that equality is prevalent only at the historical poles of civilization. Savages are equal because they are equally weak and ignorant. Very civilized men can all become equal because they all have at their disposal similar means of attaining comfort and happiness. Between these two extremes is found inequality of condition, wealth, knowledge - the power of the few, the poverty, ignorance, and weakness of all the rest. (Tocqueville, 1835, pp. 42–3)
Inequality in Europe and America: Taking the Long View ᴧ Years = Date since the local appearance of domesticated plants
Pre-Industrial Inequality and Colonialism ‘Four estimated Ginis are equal to or slightly greater than the maximum possible Gini (IPF): Moghul India 1750 (an extraction ratio of 113%), Nueva Espana 1790 (an extraction ratio of 106%), and Kenya in 1927 and Maghreb in 1880 (an extraction ratio of almost exactly 100%). All four were colonies ruled by four different powers.’ Milanovic et al (2010) Preindustrial Inequality, The Economic Journal, 121, 255–272
Sustainable Development Goals (SDGs) 2015 to 2030 17 Goals, 169 targets, ??? Indicators
‘Inequality is the defining issue of our time`. President Obama, 2011 ‘Excessive inequality is corrosive to growth; it is corrosive to society… the economics profession and the policy community have downplayed inequality for too long.’ Christine Lagarde, Managing Director of the IMF, January 2013 “We find that longer growth spells are robustly associated with more equality in the income distribution… reduced inequality and sustained growth may thus be two sides of the same coin.” Berg & Ostry(2011) Inequality and Unsustainable Growth: Two Sides of the Same Coin?IMF Staff Discussion Note. p3.
The End of Line For Poverty? John Moore, who was the Conservative Secretary of State for Social Security in 1989 claimed that poverty, as most people understood it, no longer existed in the UK and that critics of the government's policies were: “not concerned with the actual living standards of real people but with pursuing the political goal of equality ... We reject their claims about poverty in the UK, and we do so knowing that their motive is not compassion for the less well-off, it is an attempt to discredit our real economic achievement in protecting and improving the living standards of our people. Their purpose in calling ‘poverty’ what is in reality simply inequality, is so they can call western material capitalism a failure. We must expose this for what it is ... utterly false. it is capitalism that has wiped out the stark want of Dickensian Britain. it is capitalism that has caused the steady improvements in living standards this century. and it is capitalism which is the only firm guarantee of still better living standards for our children and our grandchildren.”
Faith in the Market “At present almost all elite Americans, with corporate chiefs and fashionable economists in the lead, are utterly convinced that they have discovered the winning formula for economic success – the only formula – good for every country, rich or poor, good for all individuals willing and able to heed the message, and, of course, good for elite Americans: Privatisation+Deregulation+Globalisation=Turbo-Captialism=Prosperity” Edward Luttwak (1998), Turbo Capitalism The world is plagued not so much by poverty but by a rampant “suspicion of wealth…everywhere these ideas prevail…poverty persists and spreads” George Gilder (1981) Wealth and Poverty “It is the entrepreneurs who know the rules of the world and the laws of God” George Gilder (1984) The Spirit of Enterprise
“Your faith is what you believe, not what you know." -- Mark Twain
http://www.guardian.co.uk/news/datablog/2009/mar/25/banking-g20http://www.guardian.co.uk/news/datablog/2009/mar/25/banking-g20
Europe & Middle East Civil Unrest, 2011 Bahrain Egypt Greece Spain
The Scale of the Financial Rescue in the USA & UK The bank’s profits were private but the losses belong to the public! http://news.bbc.co.uk/2/hi/business/7893317.stm
GDP Changes During UK Recessions Over the Past Hundred Years Source: NIESR http://www.niesr.ac.uk/
2% of the population - the people with the greatest needs - will bear the burden of 25% of all the cuts’ Source: Duffy, S. (2014) A Fair Society? How the Cuts Target Disabled People. Sheffield, Centre for Welfare Reform. http://www.centreforwelfarereform.org/uploads/attachment/354/a-fair-society.pdf
The Cause of the Crisis – Taking a Longer View There are many newspaper articles which discuss the causes of the global financial crisis in terms of Credit Default Swaps, Sub-prime Mortgages, Exotic Financial Derivatives, etc. – but these are symptoms not ‘real’ causes. The longer view The 1960s & 1970s were times of prosperity for working people in many ‘rich’ countries and ‘labour/workers’ received an increasing share of the national wealth – labour was a scarce resource in many rich countries. In the 1980’s and 1990’s ‘real’ wages were static or even fell and labour’s share of the national wealth declined. The labour scarcity ‘problem’ was solved by, increased immigration, off-shoring, technical change (ICT, containerisation) and anti-labour laws (e.g. Regan, Thatcher, Pinochet). The decline in the relative wealth of labour presented a problem for the economy – how could people keep spending to buy the new products? The answer was financial deregulation resulting in a huge increase in household debt i.e. households maintained high spending by borrowing money. Securitisation resulted in people with almost no income being able to borrow! The rich became relatively richer and invested their money in assets resulting in speculative bubbles e.g. dotcom, property, commodities (oil, food, etc.) This financial system collapsed in 2008
Average Labour Share of National Income in OECD Countries (Ratio of labour income to national income) Source: Guscina (2006) – The share of GDP going to Labour is just over 50% of GDP in the OECD countries and parts of Asia, around 40% in Latin America, the Middle East and North Africa, and approximately 30% in sub-Saharan Africa (Diwan, 2001)
Each bar shows the change from the median to the 60th percentile e.g increasing the Gini from 37 to 42 results in a 0.5% reduction in growth Source: Ostry et al (2014) Redistribution, Inequality and Growth. IMF Staff Discussion Note
Source: Ostry et al (2014) Redistribution, Inequality and Growth. IMF Staff Discussion Note
“new research at the OECD…finds consistent evidence that the long-term rise in inequality of disposable incomes observed in most OECD countries has indeed put a significant brake on long-term growth” OECD (2015) In It Together: Why Less Inequality Benefits All. p26
Can Redistribution Halve Poverty? Source: Besley and Burgess (2003) Halving Global Poverty. Journal of Economic Perspectives, 17, 3, 3–22
Net outflows of money from ‘poor’ to ‘rich’ countries increased rapidly during the 21st Century Source: UNDESA 2015 World Economic Situation and Prospects
The World is Very Unequal Source: Ortiz & Cummings (2011) Global Inequality: Beyond the Bottom Billion. UNICEF
Change in Real Median Weekly Incomes 1979 to 1996 by Decile Group at April 1998 Prices (After Housing Costs) (Source: Calculated from HBAI, 1998)
World Inequality Report 2018 The richest 1% continue to own more wealth than the whole of the rest of humanity Credit Suisse. (2017). Global Wealth Databook 2017 Last year saw the biggest increase in billionaires in history, one more every two days. Billionaires saw their wealth increase by $762bn in 12 months. This huge increase could have ended global extreme poverty seven times over. 82% of all wealth created in the last year went to the top 1%, while the bottom 50% saw no increase at all. Alejo et al (2018) Reward Work Not Wealth. London: Oxfam
Changes in the distribution of income growth in the USA: 1980 & 2014 Source: New York Times graphic – data from Piketty et al (2016) DISTRIBUTIONAL NATIONAL ACCOUNTS: METHODS AND ESTIMATES FOR THE UNITED STATES. NBER Working Paper 22945 http://www.nber.org/papers/w22945
Source: New York Times graphic – data from Piketty et al (2016) DISTRIBUTIONAL NATIONAL ACCOUNTS: METHODS AND ESTIMATES FOR THE UNITED STATES. NBER Working Paper 22945 http://www.nber.org/papers/w22945
Global Real Income Growth per Adult by Percentile: 1980 to 2016
UN General Assembly Definition of Child Poverty, December 2006 “Children living in poverty are deprived of nutrition, water and sanitation facilities, access to basic health-care services, shelter, education, participation and protection, and that while a severe lack of goods and services hurts every human being, it is most threatening and harmful to children, leaving them unable to enjoy their rights, to reach their full potential and to participate as full members of the society”
Child Poverty in the World In 2000, over one billion children – half the children in the world- suffered from severe deprivation of basic human need and 30% (650 million)suffered from absolute poverty (two or more severe deprivations). In 2010, over one billion children – almost half (48%) ofthe children in the world- suffer from severe deprivation of basic human need and 28% (615 million)suffer from absolute poverty (two or more severe deprivations).
Severe Deprivation of Basic Human Need for Children in 2010 (Items in Bold have improved since 2000) • Almost a third of the world’s children live in dwellings with more than five people per room or which have a mud floor. • Over half a billion children (25%) have no toilet facilities whatsoever. • Over 230 million children (11%) are using unsafe (open) water sources or have more than a 30-minute round trip to walk to collect water. • About one child in ten, aged 3 to 18, lacks access to radio, television, telephone or newspapers at home. • Seventeen percent of children under five years in the world are severely malnourished, almost half of whom are in South Asia. • 80 million children (9%) have not been immunised against any diseases or have had a recent illness causing diarrhoea and have not received any medical advice or treatment. • One child in fifteen aged between 7 and 18 (over 87 million) are severely educationally deprived - they have never been to school.
Conclusions • Absolute child poverty and severe deprivation of basic human need fell only slightly between 2000 and 2010. • However, the number (and proportion) of children suffering from some severe deprivations fell significantly. In 2010, children were less likely to suffer from • Health deprivation • Education deprivation • Water deprivation • Information deprivation • However, there was little (or no) reduction in; • Shelter Deprivation • Sanitation deprivation • Food (malnutrition) deprivation
Background Every decade since the late 1960s, UK social scientists have attempted to carry out an independent poverty survey to test out new ideas and incorporate current state of the art methods into UK poverty research. • 1968-69 Poverty in the UK survey (Peter Townsend and colleagues), • 1983 Poor Britain survey(Joanna Mack, Stewart Lansley) • 1990 Breadline Britain survey (Joanna Mack, Stewart Lansley) • 1999 Poverty and Social ExclusionSurvey (Jonathan Bradshaw and colleagues) and its 2002 counterpart in Northern Ireland (Paddy Hillyard and colleagues) • 2012 Poverty and Social Exclusion in the UK
Headline findings • Over 30 million people (almost half the population) are suffering some degree of financial insecurity. • Roughly 14 million cannot afford one or more essential household goods. • Almost 12 million people are too poor to engage in common social activities considered necessary by the majority of the population. • About 5.5 million adults go without essential clothing. • Around 4 million children and adults are not properly fed by today’s standards. • Almost 4 million children go without at least two of the things they need. • Around 2.5 million children live in homes that are damp. • Around 1.5 million children live in households that cannot afford to heat their home.
Hunger in the UK There is widespread public agreement on what constitutes a minimally acceptable diet. Over 90% agree that, for children, this means: three meals a day; fresh fruit and vegetables; and meat, fish or a vegetarian equivalent at least once a day. Yet well over half a million children live in families who cannot afford to feed them properly. ‘I go without for the children so they have proper meals. I can live on one meal a day.’ Jennie, single parent of 3 children Our research shows that, in households where children go without one or more of these basic food necessities: In 93% at least one adult skimp on their own food ‘sometimes’ or ‘often’ to ensure others have enough to eat.
Average pay is forecasted by the OBR not to return to pre-crisis levels until 2025 Source: Resolution Foundation (2018) Living Standards Outlook. London
Source: Resolution Foundation (2018) Living Standards Outlook. London
Distribution of projected UK income changes by income decile 2015 to 2023 Source: Resolution Foundation (2018) Living Standards Outlook. London