Wealth & Poverty
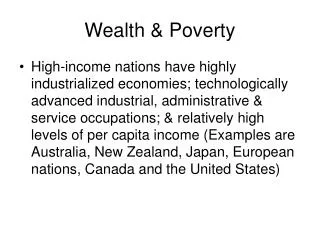
Wealth & Poverty. High-income nations have highly industrialized economies; technologically advanced industrial, administrative & service occupations; & relatively high levels of per capita income (Examples are Australia, New Zealand, Japan, European nations, Canada and the United States).

Wealth & Poverty
E N D
Presentation Transcript
Wealth & Poverty • High-income nations have highly industrialized economies; technologically advanced industrial, administrative & service occupations; & relatively high levels of per capita income (Examples are Australia, New Zealand, Japan, European nations, Canada and the United States)
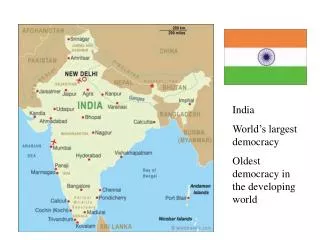
Wealth & Poverty • Middle income nations are countries undergoing transformation from agrarian to industrial economies (Examples are Columbia, Guatemala, Panama, Poland & Romania) • Low income nations are primarily agrarian (Examples are Rwanda, Mozambique, Ethiopia, Nigeria, Cambodia, Vietnam, Afghanistan, Bangladesh and Nicaragua)
Wealth & Poverty • In 2000, 20% of the world population (those that live in high-income nations) controlled 86% of the world’s GDP) • GDP = Gross Domestic Product = goods & services produced within a country • The bottom 20% controlled only 1% of the world’s GDP)
Wealth & Poverty • High income countries controlled 82% of the world’s exports • Low income countries only controlled 1% of the exports • High income countries = 74% phones • Low income countries = 1.5% phones • Low income countries = ½ of total pop
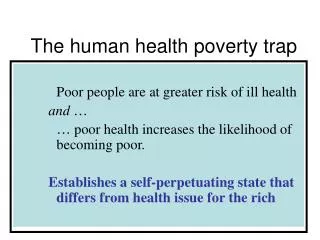
Wealth & Poverty • 1.3 billion people live in absolute poverty • 600 million people have chronic malnutrition • 40 million people die each year from hunger • The number of people dying worldwide is equal to 300+ jumbo jets crashing each day with no survivors & ½ are children
Wealth & Poverty • By 2025, middle and low income nations will increase by 60% while high income nations will increase by 11% (map 2.1) • Relative poverty occurs when people can afford basic necessities but cannot maintain an average standard of living in comparison to that of other members in their society
Wealth & Poverty • Under 18 (25% of US pop) = 40% of poor • 1 in 4 under age 6 are poor • Female headed (no adult male) = 55% of under age 6 are poor • More than ½ of all poor children live in families where at least one adult works outside the home (see figure 2.1)
Wealth & Poverty • Feminization of poverty – women are disproportionately represented among individuals living in poverty • African-Americans, Latinos and Native Americans are overrepresented among people living in poverty (figures 2.2 & 2.4)
Wealth & Poverty • Almost half of all below poverty have Medicaid • 30% of the poor have no health insurance & are overrepresented among Latinos & African-Americans • 4 million of children under age 12 are hungry every year
Wealth & Poverty • 50% of all inadequate housing units are in rural areas • Families with children accounted for 40% of all homeless individuals • African-Americans and Latinos are overrepresented among the homeless
Wealth & Poverty • FDR’s New Deal during the Great Depression of the 1930’s started the US being a welfare state (the govt takes responsibility for specific categories of people by offering them certain services and benefits, such as employment, housing, health, education or guaranteed income)
Wealth & Poverty Why poverty? • Motivational – blame the poor • Human capital – lack of assets the person brings like education, job training, etc. • Cultural – self-perpetuating system that keeps people trapped in poverty • Cultural capital – lack of social assets that are required for success
Wealth & Poverty • Social inequality – motivates people to acquire scarce resources • Capitalism – workers experience wage squeeze while shareholders & CEO’s rake in the profits