Download
1 / 114
1.14k likes | 1.53k Vues
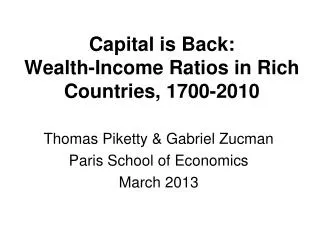
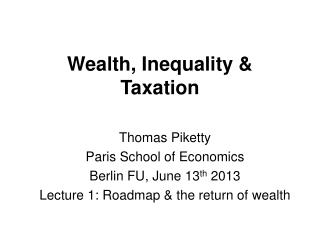
Wealth, Inequality & Taxation. Thomas Piketty Paris School of Economics Berlin FU, June 13 th 2013 Lecture 1: Roadmap & the return of wealth.

E N D
Wealth, Inequality & Taxation Thomas Piketty Paris School of Economics Berlin FU, June 13th 2013 Lecture 1: Roadmap & the return of wealth
These lectures will focus primarily on the following issue: how do wealth-income and inheritance-income ratios evolve in the long run, and why? what are the implications for optimal capital vs labor taxation? • The rise of top income shares will not be the main focus in these lectures: highly relevant for the US, but less so for Europe • In Europe, and possibly everywhere in the very long run, the key issue the rise of wealth-income ratios and the possible return of inherited wealth • If you want to know more about top incomes (=not the main focus of these lectures), have a look at "World Top Incomes Database" website; see however lecture 3
Key issue adressed in these lectures: wealth & inheritance in the long run • There are two ways to become rich: either through one’s own work, or through inheritance • In Ancien Regime societies, as well as in 19C and early 20C, it was obvious to everybody that the inheritance channel was important • Inheritance and successors were everywhere in the 19C literature: Balzac, Jane Austen, etc. • Inheritance flows were huge not only in novels; but also in 19C tax data: major economic, social and political issue
Question: Does inheritance belong to the past? Did modern growth kill the inheritance channel? E.g. due to the natural rise of human capital and meritocracy? Or due to the rise of life expectancy? • I will answer « NO » to this question: I find that inherited wealth will probably play as big a role in 21C capitalism as it did in 19C capitalism • Key mechanism if low growth g and r > g
An annual inheritance flow around 20%-25% of disposable income is a very large flow • E.g. it is much larger than the annual flow of new savings (typically around 10%-15% of disposable income), which itself comes in part from the return to inheritance (it’s easier to save if you have inherited your house & have no rent to pay) • An annual inheritance flow around 20%-25% of disposable income means that total, cumulated inherited wealth represents the vast majority of aggregate wealth (typically above 80%-90% of aggregate wealth), and vastly dominates self-made wealth
Main lesson: with g low & r>g, inheritance is bound to dominate new wealth; the past eats up the future g = growth rate of national income and output r = rate of return to wealth = (interest + dividend + rent + profits + capital gains etc.)/(net financial + real estate wealth) • Intuition: with r>g & g low (say r=4%-5% vs g=1%-2%) (=19C & 21C), wealth coming from the past is being capitalized faster than growth; heirs just need to save a fraction g/r of the return to inherited wealth • It is only in countries and time periods with g exceptionally high that self-made wealth dominates inherited wealth (Europe in 1950s-70s or China today) • r > g & g low might also lead to the return of extreme levels of wealth concentration (not yet: middle class bigger today)
These lectures: three issues (1) The return of wealth (Be careful with « human capital » illusion: human k did not replace non-human financial & real estate capital) (2)The return of inherited wealth (Be careful with « war of ages » illusion: the war of ages did not replace class war; inter-generational inequality did not replace intra-generational inequality) (3) The optimal taxation of wealth & inheritance (With two-dimensional inequality, wealth taxation is useful) (1) : covered in Lecture 1 (now) (2)-(3) : covered in Lectures 2-3
Lectures based upon: • « On the long-run evolution of inheritance: France 1820-2050 », QJE 2011 • « Capital is back: wealth-income ratios in rich countries 1700-2010 » (with Zucman, WP 2013) • « Inherited vs self-made wealth: theory & evidence from a rentier society » (with Postel-Vinay & Rosenthal, 2011) • On-going work on other countries (Atkinson UK, Schinke Germany, Roine-Waldenstrom Sweden, Alvaredo US) → towards a World Wealth & Income Database • « A Theory of Optimal Inheritance Taxation » (with Saez, Econometrica 2013) • « Optimal Taxation of Top Labor Incomes » (with Saez & Stantcheva, AEJ:EP 2013) (all papers are available on line at piketty.pse.ens.fr)
1. The return of wealth • How do aggregate wealth-income ratios evolve in the long-run, and why? • Impossible to address this basic question until recently: national accounts were mostly about flows, not stocks • We compile a new dataset to address this question: • 1970-2010: Official balance sheets for US, Japan, Germany, France, UK, Italy, Canada, Australia • 1870-: Historical estimates for US, Germany, France, UK • 1700-: Historical estimates for France, UK
The Return of Wealth: W & Y Concepts Wealth Private wealth W = assets - liabilities of households Corporations valued at market prices through equities Government wealth Wg National wealth Wn = W + Wg National wealth Wn = K (land + housing + other domestic capital) + NFA (net foreign assets) Income Domestic output Yd = F(K,L) (net of depreciation) National income Y = domestic output Yd + r NFA Capital share α = rβ (r = average rate of return) β = W/Y = private wealth-national income ratio βn = Wn/Y = national wealth-national income ratio
We Find a Gradual Rise of Private Wealth-National Income Ratios over 1970-2010
European Wealth-Income Ratios Appear to be Returning to Their High 18c-19c Values…
…Despite Considerable Changes in the Nature of Wealth: UK, 1700-2010
In the US, the Wealth-Income Ratio Also Followed a U-Shaped Evolution, But Less Marked
What We Are Trying to Understand: The Rise in Private Wealth-National Income Ratios, 1970-2010
An asset price effect: long run asset price recovery driven by changes in capital policies since world wars A real economic effect: slowdown of productivity and pop growth: Harrod-Domar-Solow: wealth-income ratio β = s/g If saving rate s = 10% and growth rate g = 3%, then β ≈ 300% But if s = 10% and g = 1.5%, then β ≈ 600% How Can We Explain the 1970-2010 Evolution? Countries with low g are bound to have high β. Strong effect in Europe, ultimately everywhere.
In very long run, limited role of asset price divergence In short/medium run, war destructions & valuation effects paramount But in the very long run, no significant divergence between price of consumption and capital goods Key long-run force is β = s/g How Can We Explain Return to 19c Levels? One sector model accounts reasonably well for long run dynamics & level differences Europe vs. US
In any one-good model: At each date t: Wt+1 = Wt + stYt → βt+1 = βt (1+gwst)/(1+gt) 1+gwst = 1+st/βt= saving-induced wealth growth rate 1+gt = Yt+1/Yt= output growth rate (productivity + pop.) In steady state, with fixed saving rate st=s and growth rate gt=g: βt →β = s/g(Harrod-Domar-Solow formula) Example: if s = 10% and g = 2%, then β = 500% Accounting for Wealth Accumulation: One Good Model
β = s/g is a pure accounting formula, i.e. it is valid wherever the saving rate scomes from: BU: Bequest-in-utility-function model Max U(c,b)=c1-s bs (or Δbs) c = lifetime consumption, b = end-of-life wealth (bequest) s = bequest taste = saving rate → β = s/g DM: Dynastic model: Max Σ U(ct)/(1+δ)t → r = δ +ρg , s = αg/r, β = α/r = s/g ( β↑ as g ↓) ( U(c)=c1-ρ/(1-ρ) , F(K,L)=KαL1-α ) OLG model: low growth implies higher life-cycle savings → in all three models,β = s/g rises as g declines
Two goods: one capital good, one consumption good Define 1+qt = real rate of capital gain (or loss) = excess of asset price inflation over consumer price inflation Then βt+1 = βt (1+gwst)(1+qt)/(1+gt) 1+gwst = 1+st/βt= saving-induced wealth growth rate 1+qt = capital-gains-induced wealth growth rate Accounting for Wealth Accumulation: Two Goods Model
Low β in mid-20c were an anomaly Anti-capital policies depressed asset prices Unlikely to happen again with free markets Who owns wealth will become again very important β can vary a lot between countries s and g determined by different forces With perfect markets: scope for very large net foreign asset positions With imperfect markets: domestic asset price bubbles Lesson 1a: Capital is Back • High β raise new issues about capital regulation & taxation
Private Wealth-National Income Ratios, 1970-2010, including Spain
From Private to National Wealth: Small and Declining Government Net Wealth, 1970-2010
In 21st century: σ > 1 Rising β come with decline in average return to wealth r But decline in r smaller than increase in β capital shares α = rβ increase Consistent with K/L elasticity of substitution σ > 1 In 18th century: σ < 1 In 18c, K = mostly land In land-scarce Old World, α ≈ 30% In land-rich New World, α ≈ 15% Consistent with σ < 1: when low substitutability, α large when K relatively scarce Lesson 1b: The Changing Nature of Wealth and Technology
… And Slightly Declining Average Returns to Wealth σ > 1 and Finite
End of Lecture 1: what have we learned? • A world with low g can naturally leads to the return of high non-human wealth: capital is back because low growth is back → A world with g=1-1.5% (=long-run world technological frontier?) is not very different from a world with g=0% (Marx-Ricardo) • The rise of human capital is largely an illusion; non-human capital share can be larger in the future than what it was in the past; robot economy possible • Next question: will the return of wealth take the form of egalitarian lifecycle wealth, or highly concentrated inherited wealth?
Wealth, Inequality & Taxation Thomas Piketty Paris School of Economics Berlin FU, June 13th 2013 Lecture 2: The return of inherited wealth
Roadmap (1) The return of wealth (already covered in Lecture 1; I will just start by presenting a few more technical results) (2)The return of inherited wealth (=what we will cover in Lecture 2) (3) The optimal taxation of wealth & inheritance (we will start this part in case we have time; otherwise this will be covered in Lecture 3)
1. The Return of Wealth: W & Y Concepts Wealth Private wealth W = assets - liabilities of households Corporations valued at market prices through equities Government wealth Wg National wealth Wn = W + Wg National wealth Wn = K (land + housing + other domestic capital) + NFA (net foreign assets) Income Domestic output Yd = F(K,L) (net of depreciation) National income Y = domestic output Yd + r NFA Capital share α = rβ (r = average rate of return) β = W/Y = private wealth-national income ratio βn = Wn/Y = national wealth-national income ratio
In any one-good model: At each date t: Wt+1 = Wt + stYt → βt+1 = βt (1+gwst)/(1+gt) 1+gwst = 1+st/βt= saving-induced wealth growth rate 1+gt = Yt+1/Yt= output growth rate (productivity + pop.) In steady state, with fixed saving rate st=s and growth rate gt=g: βt →β = s/g(Harrod-Domar-Solow formula) Example: if s = 10% and g = 2%, then β = 500% Accounting for Wealth Accumulation: One Good Model
Two goods: one capital good, one consumption good Define 1+qt = real rate of capital gain (or loss) = excess of asset price inflation over consumer price inflation Then βt+1 = βt (1+gwst)(1+qt)/(1+gt) 1+gwst = 1+st/βt= saving-induced wealth growth rate 1+qt = capital-gains-induced wealth growth rate Accounting for Wealth Accumulation: Two Goods Model
Our Empirical Strategy • We do not specify where qtcome from • maybe stochastic production functions for capital vs. consumption good, with different rates of technical progress • We observe βt, …, βt+n st, …, st+n gt, ..., gt+n and we decompose the wealth accumulation equation between years t and t + n into: • Volume effect (saving) vs. • Price effect (capital gain or loss)
Data Sources and Method, 1970-2010 • Official annual balance sheets for top 8 rich countries: • Assets (incl. non produced) and liabilities at market value • Based on census-like methods: reports from financial institutions, housing surveys, etc. • Known issues (e.g., tax havens) but better than PIM • Extensive decompositions & sensitivity analysis: • Private vs. national wealth • Domestic capital vs. foreign wealth • Private (personal + corporate) vs. personal saving • Multiplicative vs. additive decompositions • R&D
1970-2010: A Low Growth and Asset Price Recovery Story • The rise in β is more than a bubble • Key results of the 1970-2010 analysis: • Non-zero capital gains • Account for significant part of 1970-2010 increase • But significant increase in β would have still occurred without K gains, just because of s & g