Download
1 / 15
170 likes | 601 Vues
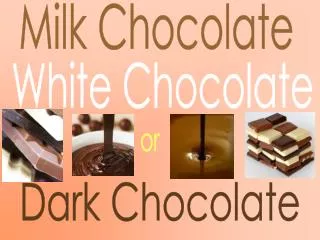
Milk Chocolate. White Chocolate. or. Dark Chocolate. We went around to classrooms and the cafeteria (during lunch) and asked students and faculty to close their eyes and sample three different types of chocolate. Classrooms and students were chosen at random. After tasting all

E N D
Milk Chocolate White Chocolate or Dark Chocolate
We went around to classrooms and the cafeteria (during lunch) and asked students and faculty to close their eyes and sample three different types of chocolate. Classrooms and students were chosen at random. After tasting all three they were asked which they preferred (1 2 or 3), their grade level and their gender. Fifty people total were sampled. 3 1 2
Male Female Milk 17 14 White 5 5 Dark 4 5 After Tasting the Chocolates the Individuals Were Asked which they Preferred Which did you prefer??? #1 Male #2 Female #3 These Were the Results:
experiment We chose to do our experiment as a taste test so that it would be more accurate. We wanted to make sure that people had the taste of each type of chocolate fresh in their mind before writing their preference.
Possible biases Our experiment could have been hurt by a number of different things: • The people we surveyed could have been influenced by their friends’ reactions, or by the fact that they did not truly want to participate. We should have isolated people as they were being surveyed. • We did not provide options for those who liked two types of chocolate, or those who did not like chocolate at all. • we used different brands for each type of chocolate. Had we used the same brand, such as all Hershey's, the texture would have been more similar. • We used unsweetened dark chocolate, which could have made even people who prefer dark chocolate dislike it. • We could have varied the order in which we gave people the chocolate types.
Male Female vs Male Female
CLAIM The null hypothesis (the H0) is that the number of males and females who actually prefer milk, white, and dark chocolate matches the distribution claimed by http://www.misterpoll.com/polls/517143/results. The alternative hypothesis (the Ha) is that the number of males and females who actually prefer milk, white, and dark chocolate does not match the distribution claimed by http://www.misterpoll.com/polls/517143/results. Chocolate Percent Frequency Milk (male) 20% 47 White (male) 10% 24 Dark (male) 23% 55 Milk (female) 20% 49 White (female) 11% 26 Dark (female) 14% 34 235 voters have answered this question.
Chocolate Preference: Expected (Given) http://www.misterpoll.com/polls/517143/results.
Chocolate Preference: Observed There were no outliers in our data.
We chose to use a chi squared goodness of fit test. We did this because we wanted to compare our data to the data that we found in a poll on a website.
X =10.937 2 d.f.= (6-1) 5 Level of Significance= .05
At the 5% level of significance, there is not enough evidence to reject the claim. Therefore, the number of males and females who actually prefer milk, white, and dark chocolate matches the distribution claimed by http://www.misterpoll.com/polls/517143/results. Expected Observed Type Male Female Total Type Male Female Total Milk 17(34%) 14(28%) 31(62%) Milk 10(20%) 10.4(20.8%) 20.4(40.9%) White 5(10%) 5(10%) 10 (20%) White 11.7(23.4%) 5.5(11%) 17.2 (34.5%) Dark 4(8%) 5(10%) 9(18%) Dark 5.1(10.2%) 7.2(14.4%) 12.3(24.6%) Total 26(52%) 24(48%) 50(100%) Total 26.8(53.7%) 23.1(46.3%) 49.9(100%)
conclusion We predicted that the distribution of students and faculty in our school who preferred milk, white, and dark chocolate would match the survey that we found on http://www.misterpoll.com/polls/517143/results. The online survey stated that 20% of those surveyed were males who preferred milk chocolate, 20.8% were females who preferred milk chocolate, 23.4% were males who preferred white chocolate, 11.0% were females who preferred white chocolate, 10.2% were males who preferred dark chocolate, and 14.4% were females who preferred dark chocolate. Our test showed that our results matched theirs.
What we would change If we had to repeat our experiment, we would: • Separate people as they were being surveyed. • Make sure all of the chocolates were the same brand. • Put the chocolates in a random order. • Use more class time to survey a larger group of people for more accurate results.
After conducting our test on which chocolate students and faculty preferred, we went a step further to see if we could find a pattern in chocolate preferences by age. These Were the Results: There was no apparent pattern.