Understanding Disturbance-Based Forest Management and Ecosystem Complexity
This overview explores disturbance-based management approaches in forestry, focusing on stand age class distributions, patch dynamics, and habitat representation. It examines the characteristics of structural complexity, including vertical and horizontal structures, and the role of biological legacies in ecological recovery, as seen at Mount St. Helens. The document delves into the importance of variable retention harvesting, multi-aged silviculture, and management strategies that enhance biodiversity and ecosystem resilience over longer rotation periods.

Understanding Disturbance-Based Forest Management and Ecosystem Complexity
E N D
Presentation Transcript
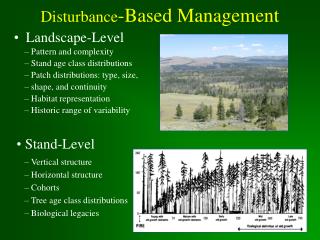
Disturbance-Based Management • Pattern and complexity • Stand age class distributions • Patch distributions: type, size, • shape, and continuity • Habitat representation • Historic range of variability • Landscape-Level • Stand-Level • Vertical structure • Horizontal structure • Cohorts • Tree age class distributions • Biological legacies
Recovery facilitated by biological legacies at Mount St. Helens Photos courtesy of Jerry F. Franklin, University of Washington
Large-scale Windthrow: Hurricanes Fine-scale Windthrow Ice Storms Insect and Pathogens Outbreaks
Structural Change Through Stand Development Figure adapted from Franklin and Spies (1991).
Variable Retention Harvest System 0 % 20 % Retention at Harvest 80 % 20 % 100 % 80 % Removal at Harvest 1 Entries per Rotation 2 - 3 4 or more Even-aged (1 class) Multi-aged (2-3 classes) Age Classes Uneven-aged (4 or more classes) Figure from Franklin et al. (1997)
Teakettle Ecosystem Experiment Forest Ecosystem Research Network
Weyerhaeuser Co. Variable Retention Adaptive Management (VRAM) Experiment
Year 0 Year 15
What have we learned about natural disturbance effects? • Scale and frequency of disturbance
Mimicking scale and frequency of disturbances Figures from Seymour et al. 2002
What have we learned about natural disturbance effects? • Coarse-woody debris: snags and downed wood
Coarse Woody Debris in Northern Hardwood Forests • Habitat • Nitrogen Fixation • Soil organic matter • Mycorrhizal fungi • Nurse logs • Erosion reduction • Riparian functions Even-aged Single-tree Selection Old-Growth Figure from McGee et al. (1999)
What have we learned about natural stand development? • Importance of large trees as structural elements
Crown Release to Increase the Representation of Large Trees Full crown release Partial crown release 60 No release DBH (cm) 30 150 300 Age (Years) Data from Singer and Lorimer (1997)
What have we learned about natural stand development? • Vertical complexity • Horizontal complexity
Structural Complexity Index (Zenner 2000) A) B) = Ratio of 3D area in A to 2D area in B
Uneven-aged Forestry • Single-tree selection • Group selection • BDq prescriptions are based on the desired: • residual basal area • maximum dbh • q-factor
Single-Tree Selection Prescription for Mt. Mansfield Unit 4: q-factor of 1.3, maximum diameter of 24", and residual basal area of 80 ft2/acre # Stems per Acre Diameter Class in Inches
Diameter Distributions Figure from Goodburn and Lorimer (1999)
Unbalanced Diameter Distributions: • Density-dependent mortality reduced with fewer stems in smaller size classes • Equal allocation of growing space not found consistently Figure from Goodburn and Lorimer (1999)
Multi-modal distributions due to old-tree legacy Figure from Seymour 2005
Yield vs. Big Tree Structure in Northern Hardwoods Selection harvest + old-growth structure after multiple cutting cycles Maximized volume production Maximized large sawtimber volume and value growth 50 cm max. 80-100 cm max. 40 cm max. Data from Hansen and Nyland (1987) Data from Goodburn and Lorimer (1999)
An Alternative: Multi-aged Silviculture • Recognizes that “reverse J” is limiting • Other stand structures are sustainable • Ecological functions more closely associated with canopy structure • All-aged stands are rare in actuality • Management based on the desired number of canopies provides a better alternative • Set objectives based on canopy strata two-aged and multi-aged are possibilities
Multi-aged distributions resulting from multiple disturbances Trees/ha Diameter Class
Growing space allocation approaches • Leaf area index • Stand density index • MASAM model (O’Hara 1998)
Conversion to Multi-Aged or Multi-Canopied Understory growth Overstory growth High High Shift in growing space from one strata to another also shifts growth increment Understory Overstory Low Low 0 50 100 Overstory growing space occupied (%) Figure from O’Hara (1998)
Managing for Canopy Strata • Fewer and longer cutting cycles • Management across multiple spatial scales • Need combination of single and multi-layered stands to maximize biodiversity potential
Extended Rotations 300 Periodic annual increment Cubic ft./acre/year Mean annual increment 0 10 100 Stand age
Advantages of extended rotations: • Reduced land area in regeneration and early-development stages, hence: • Reduced visual impacts • Lower regeneration and respacing costs • Less need for herbicides, slash burning, etc. • Reducing frequency of intense disturbance • Large tree and higher-quality wood • Adjust precently unbalanced age distributions • Higher quality habitat for species associated with late-successional forest structure • Hydrologic benefits • Increased carbon stock associated with increased net biomass/larger growing stock • Preservation of options for future adaptive management
Simulated landscape based on individual stand structures + important features (e.g. roads, streams, etc.)