Exploring Ocean Temperatures and Marine Life
60 likes | 158 Vues
Join the interactive session to discuss the impact of ocean temperatures on marine species. Learn about Ocean Home Swimming Fish activity and how it relates to varying ocean temperatures. Dive into SST maps to understand changes over time.

Exploring Ocean Temperatures and Marine Life
E N D
Presentation Transcript
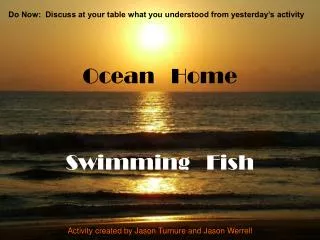
Do Now: Discuss at your table what you understood from yesterday’s activity Ocean HomeSwimming Fish Activity created by Jason Turnure and Jason Werrell
Ocean temperatures vary by season and often by major geologic events.
Ocean Pout Macrozoarces americanus Start: 8A Atlantic Cod Gadus morhua Start: 8B Atlantic Herring Clupea harengus Start: 8C Winter Flounder Pseudopleuronectes americanus Start: 8D
Sea Surface Temperature 2000 2020 2040 2060 2080 2100 Blue/purple Colder Orange/red Warmer
Sea Surface Temperature(SST) • How to read an SST map http://new.coolclassroom.org/img/adventures/plume/popup_sst_tutorial.htm • Detailed explanation for SST map http://rucool.marine.rutgers.edu/index.php/COOL-Data/How-to-read-Sea-Surface-Temperature-Map.html • Current SST map http://marine.rutgers.edu/cool/sat_data/?product=sst¬humbs=0