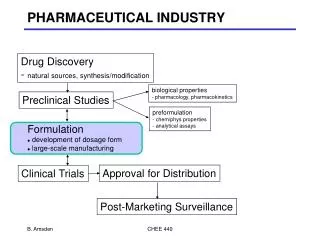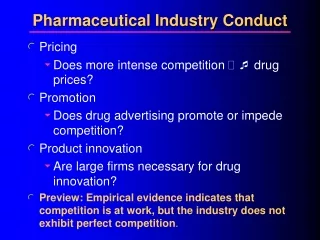
Pharmaceutical Industry
Pharmaceutical Industry. World industry : (2008). %. Medical ind. Telecom. Comp . Mining and Oil. Small machine. Entertainment. Machine ind. Tobacoo. Pharma. War ind. Food. 14.3. 11.1. 7.3. 14.1. 8.7. 7.1. 6.8. 6.1. 5.8. ca. 2 million employee 200 thousend R&D(!!!).

Pharmaceutical Industry
E N D
Presentation Transcript
World industry: (2008) % Medical ind. Telecom. Comp. Mining and Oil Smallmachine Entertainment Machine ind. Tobacoo Pharma War ind. Food 14.3 11.1 7.3 14.1 8.7 7.1 6.8 6.1 5.8 ca. 2 million employee 200 thousend R&D(!!!) Total income: ~ 640 billion$(+10 %) Total profit: ~ 90 billion$(P/I = 15%) R&D: ~ 30 billion$ (30%) Straighforward research Big R&D budget Hung GDP 140 billion$ Hungbudget 60 billion$ OTKA 0.4 billion$ Manhattan project: 22 B $ / 5 year Apollo program: 98 B $ / 14 year
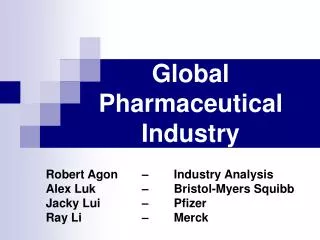
Largest Pharmaceutical Companies(2012) www.fortune.com
ACADEMIC RESEARCH GOVERMENT TAXES TENDERS Academy Reserch Inst., Universities Akadémiai Kutatóintézetek, egyetemek TAXES SUPPORT PROFIT RESULTS PHARMACEUTICAL COMPANY DRUG PRODUCTION RESEARCH DEVELOPMENT CLINICS
Diseases sickness, head-ache Fever, etc. Symptom Reason symptomatic treatment BODY LEVEL Old therapy Surgery ORGAN LEVEL „DOGMA”: Most of the diseases has molecular background! Immunology Modern therapy CEL LULAR LEVEL Medication: Influencing Molecular targets Activation, inhibition Medicines MOLECULAR LEVEL
MOLECULAR TARGET BASED TREATMENT CellularInformation Network error
Therapeuticarea: Cardiovasculardisease (thrombosis, arteriosclerosis, …) Metabolicdisease(diabetes, osteoporosis, sterility, hormones, obesity, …) Central nervous system (depression, psychiatric disease …) Innerreason(lifestyle, hereditary) Respiratoryand immunologydisease (astma, copd, …) Onkology Contagion (bacteria, virus, fungous, otherparasites, …) Outerreason
DRUG RESEARCH Basic research Receptors Enzymes Diseases Drug product Discovery Development Biol. target Drugcandidate Clinics Drug store drug substance DRUG RESEARCH DRUG MARKETING
Life cycle of drugs CLINICS Development DISCOVERY PRODUCTIONS Research PRECLINICS PHASE I PHASE II PHASE III LICENC Leadcpd approval Candidate technology Drug product Drug Drug substance Synthetic route HTS Chemical dev. Lead opt. Production of Clinical batches Industrial Dev. Industrialbatches In vitro In vivo, animal trials Healthy people 100 diseased people 100-5000 person Real population 1000-50000 patients, many countries, many race marketing 0 2 4 5 7-8 11-13 2 2 1 2-3 4-5 SPEED QUALITY ECONOMY
Discovery: 2–3 years Input: receptor with known effect 105compound Goal: find an active compound target highthroughputscreening (HTS) 101–102compound (severalclusters) optimization target ~10 lead compound (2-4 clusters) optimization Candidate 2-3 cpds Development
Bioactivity Selectivity Marketing Drug molecule Pharmaceutical properties Side-effect Adsorption Distribution Metabolism Elimination ADME Genotoxicological profile Toxicological profile Optimal Real Poor
Preclinicaldevelopment: 2 years Input:candidate (2-3 cpds) Goal: develop the drug Synthesisoptimization Scale-up analitics Kg scale Drug substance Physical qualitydevelopment Salt formation, polymorphism, Particle size Defined crystal form Formulation stabilization, solubility increase Drug product clinics
Impurityprofile Toxicology of impurities Non-toxic Toxic Genotoxic Marketable Non-marketable Marketing Drug substance Accuracy Reliablility Economically friendly Risky Ecology Supplier Productivity Safety Robusstness Marketable Non-marketable Economy Technology Pharmaceutical properties Optimal Real Poor
Clinical trials: 6–8 years 50 – 100 people Maximal dose and side-effects Healthy volunteers Phase I uncertainty: 90% Treatment dose determination Phase IIa 200 – 1000 people Special diseased people Proof of concept Phase II 1000 – 5000 people Normal diseased people Drug efficiency Phase IIb uncertainty : 75% Real sample of the population 10000 – 50000 people Phase III uncertainty : 40% Phase IV Requiest Approval uncertainty : 10%
What is the DRUG Chemical synthesis, technology Known impurity profile Defined particle size distribution, polymorphism Known biological effect, toxicity Known metabolism, pharmacokinetics Industrial capacity, starting materials, suppliers Marketing, Market Patents, etc. Chemical structure
Strategy 1. PATENT ~ 25 years Intelectualproperties and patents END OF THE ORIGINAL START ~ 12 years ~ 1-2 years ~ 12 years R&D marketing PROFIT ~ 1 billion $ ~ 200-300 million $/year
Typicallife-cycle of a drug MARKETING R & D GOLDEN AGE GENERIC COMPANIES Profit/year 12 y 25 y Invest/year Intelectualproperties and patents
Typicallife-cycle of a company Blockblusters Overall Profitability Profit/year 12 y 25 y Loosers
red green = blue Drug research R$D expense for one drug product problem 1980 – 200 million$ 1990 – 500 million$ 2000 – 1000 million$ 2010 – 1700 million$
FALSE in DRUG COMPANIES 1. 3 billions $ Workedatmolecularlevel Doesnotworkatcellularlevel -ADME Metabolism -No human Activity -Toxicity X Rimonabant Sanofi -Animal Toxicity Dyrk 1A inhibitor (Onkology, Apoptosis) Genotoxicity Riskyproduct Side-product (incr. numb. of suicide) No in vivo activity Research Development Clinics Filing Market - No profit - No market 0 2 4 6 8 10 12 14
FALSE in DRUG COMPANIES 2. Selective V2-vasopressin Antagonist (Triggers Excretion of Water Only) FASTER TOO SLOW Research Clinics & Development Filing 0 2 4 6 8 10 12 14
FALSE in DRUG COMPANIES 3. D2/D3 receptor antagonist (Antidepressant) Generic Original Patent exp. Research Clinics & Development Filing Original 0 2 4 6 8 10 12 14 16
Resources to obtain the same results now experiments Invested resource computations 2025 1900 1925 1950 1975 2000 2025 2025 idő
Homo sapiens Organs Tumor BIOLOGY Cell Mitocondria (2046) Protein Complex(2036) C H E M I S T R Y Protein (2026) Peptides (2006) Drugs(1986) H(1926)
Rareuse Severalmethods No application Intensiveuse Manymethods Discovery Development Clinics Modeling Docking Virtual screening QSAR Pharmacophore Similarity Dynamics Homology etc… Reactionmechanism Ab-initio „Statistics”
? Discoveryresearch 20 000 pdb 100 000 protein Ligand-basedmethod (indirectdrug design) Structure-basedmethod (directdrug design) -Protein structure not known -Known ligand structures -Protein-ligand structurenotknown -Interactionsnotknown -Known protein structure -Known ligand structure -Known protein-ligand structure -Knowninteractions Pharmacophore modelling Docking QSAR* *Quantitative structure-activity relationship
EXAMPLE 1. QSAR = a theoreticalmethod, usingexperimentalvalues What is the appropriate length? parameter = length of the chain response= activity
EXAMPLE 1. What is the appropriate chemical moiety LogP LogD pKa PSA New candidate
Ligand-basedmethod (QSAR) Mathematicalmethod, basedonexperimentaldata Largergroup of known active and inactive compounds Test set Smallgroup of known activecompounds Largedataset withunknown activity Mathematical Model N-dimensional Selection of N parameter Trainingset Data set Mathematical Model N-dimensional Works NO YES Filtering Correlation between calculated properties of molecules and their experimentally determined biological activity, may be derived. These QSAR relationships in turn may be used to predict the activity of new analogs. New analogues
Ligand-basedmethod (QSAR) Many dimensional relationship Many variablesor Parametersordescriptors parameters: MW, lenght polarity (descriptors) hydrophobicity distance steric effect aromaticity hydrogen bonding number of heteroatom LogP LogD pKa number of HBD number of HBA number of OH groups HOMO-LUMO gap etc Fewthousandsdescriptors exist
Limitations 1 • More than one maxima on the N-dim surface • No direct function from the set of descriptors to chemical structure = more solution • Difficult curve fitting • Large error in the measured values, • Difficult to see the border of the inactive and active Activity error Descriptor Homo-Lumogap Hydrophobicity Polarsurfacearea LogP
Limitations 3 Outlier ???
Limitations 4 Activenon-activeborders Actives Inactives
Limitations 5 Falsecorrelations
Ligand-basedmethodPharmacophore modelling Molecules may be used to derive a pharmacophoremodel that defines the minimum necessary structural characteristics a molecule must possess in order to bind to the target. In other words, a model of the biological target may be built based on the knowledge of what binds to it, and this model in turn may be used to design new molecular entities that interact with the target.
Ligand-basedmethod (PM) Goal: To find the suitable chemical structure pharmacophores d2 d1 Interactions: Polar, Apolar, HB, Aromatic, Ionic
Ligand-based method (PM) Example 1 d1 d1 d2 d2 d3 d3 d1 L-LIPOPHILIC SITE D-H- BOND DONOR PD-PROTONATED H- BOND DONOR d2 d3 PHARMACOPHORE MODEL
Ligand-based method (PM) Example 2
7.5-8.5Å Anionic site 6.5Å Focus of charge * Cavity for part of piperidine ring Flat surface for aromatic ring Example: Receptor Map for Opiate Narcotics R3 R2 R1 Morphine, Codeine, Heroin 3D structurebased Pharmacophore search
Ligand-basedmethod (PM) Pharmacophorefiltering Mathematicalmethod, basedonexperimentaldata Largergroup of known active and inactive compounds Test set Smallgroup of known activecompounds Largedataset withunknown activity Mathematical Model N-dimensional Selection of N-pharmaco- phores Trainingset Data set Mathematical Model N-dimensional Works NO YES Filtering New analogues
Structure Based Ligand Design Building Molecules at the Binding Site ReversePharmacophoremodeling Evaluate their disposition in space Identify the binding regions Search for molecules in the library
Structure Based Ligand Design ReversePharmacophoremodeling
Structure based ligand design O O O H ReversePharmacophoremodeling 0 Define Pharmacophore Ligand Design O O H H H O O O O H O H O O DB Search
Docking Protein (receptor orenzyme) - druginteraction DGbinding + docking Interaction: - hidrofobic - hidrofilic - polar - apolar - hydrogen bonding - aromatic – aromatic
Approaches to Docking • Qualitative • Geometric • shape complementarity and fitting • Quantitative • Energy Calculations • determine minimum energy structures • free energy measure • Hybrid • Geometric and energy complementarity • 2 phase process: rigid and flexible docking
1. Rigid Docking • Shape-complementarity method: find binding mode(s) without any steric clashes • Only 6-degrees of freedom (translations and rotations) • Move ligand to binding site and monitor the decrease in the energy • Only non-bonded terms remain in the energy term • Try to find a good steric match between ligand and receptor Fit intobasket -Fast, effective, (millioncpds/day) -Inaccurate
2. Flexible Docking I. (FlexX, AutoDock) • Dock flexible ligandsinto binding pocket of rigid protein • Binding site broken down into regions of possible interactions 1. 2. hydrophobic H-bonds binding site from X-ray parameterised binding site
2. Flexible Docking II. (FlexX, AutoDock) • Then dock the molecule into pocket by matching up interactions with ligand • Uses “random” translation, rotation, and torsion, and look for a better binding mode. 3. 4. parameterised binding site docked ligand -Slower (thousendscpds/day) -Moreaccurate
2. Flexible Docking III. (Glide) • Even though we have considered the ligand to be flexible, the active site was kept as a rigid structure. • The side chains of the protein in the vicinity of the active site should be flexible, but computationally more expensive.