Download
1 / 18
180 likes | 371 Vues
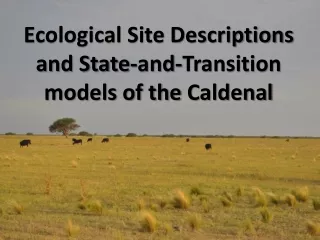
Ecological Site Descriptions and State-and-Transition models of the Caldenal. Sampling Points. Random: statistically valid design Selected: knowledge of historical management. Random Points.

E N D
Ecological Site Descriptions and State-and-Transition models of the Caldenal
Sampling Points • Random: statistically valid design • Selected: knowledge of historicalmanagement
Random Points • One hundred points were randomly distributed using ArcGIS throughout the various soil types documented by the INTA Provincia de La Pampa 1976 soil survey for the caldenal ecoregion • The points were converted into a .kmz file and transferred to Google Earth
Random Points • Is the point in an area with calden? • Is it near an area with calden? • Is it near an accessible road? • Is it near a house or farming facility? N
Random Points PA 3a PA 3
Selected Points • Sites with known management regimes where data can be obtained from the producer/land owner • Sites with spatial interest based on imagery analysis • Sites in the vicinity of randomly selected points that demonstrate potentially valuable information
Selected Points • Example Parque Luro N • Area has not been burned since the 1980s, nor grazed since the 1970’s • Trees show signs of mortality due to competition
The Samples • Soil pit • Vegetation transect • Belt transect (tree and shrub) • Soil surface classifications
Sampling Design 20x20m soil surface quadrant Soil pit 1-3m Line-point intercept every 20cm Photo Photo 2-10m Belt transect 30m Downslope (if flat, transect placed North/South)
Soil pit • 50x50cm profile pit was dug to 40cm • Samples were augered and laid in order by depth from 40cm to 100cm • The soil was then characterized using the USDA-NRCS Soil Survey Field Manual including: horizon descriptions, effervescence (reaction to NHcl), color, % clay, hand texture, grade, structure, size, and landscape descriptions
Vegetation transect • The transect was placed 1-3m above the soil pit if there was a slope (3% or more) or 1-3m to the East if it was a flat area (1-2% slope), and was centered on the soil pit • The transect was read every 20cm with a pin flag. The plants and surface that the pin touched were noted.
Belt transect • The belt was placed on the side of the transect opposite the soil pit • The trees and shrubs were inventoried and put into categories based on size per species. • The trees and shrubs were recorded based on what category they fall under, along with the % dead canopy and % cover within the belt.
Soil Surface Characterization of the soil surface (those which dominated the 20x20m quadrat) based on plant patch composition (resource retention class), erosional status (soil retention class) and physical state of the soil surface (pedoderm class) was accomplished utilizing the classifications set by Brandon Bestelmeyer with his manual on surface classifications (to be published).
Overall description • Photos were taken with a Nikon D5000 camera 2m back from each end of the transect. Photos were also taken along the transect of the surrounding landscape and points of interest. • A description of the site was written including general description of the state, notes on the dominant plant species and compositions, landscape characteristics, an overview of the soil, evidence of disturbance, and a preliminary interpretation of the site dynamics.
Defining Ecological Sites A preliminary map of ecological sites was developed from the soil samples taken by field collections, use of the INTA Provincia de La Pampa 1976 soil survey, and references to the 2005 landsat dem of La Pampa for landscape features for the region of calden forests.
Defining States Preliminary models of state-and-transitions according to the dominant soil types of the caldenal ecoregion are being developed. Discussions regarding the formation of these models and essential questions that need to be addressed in the development process are currently