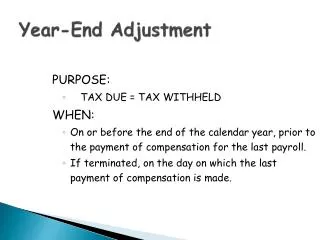
Year End Behavior Data
Year End Behavior Data. Robbinsdale Middle School 2011-2012. 23. Optimal:. 6+ referrals 2-5 referrals 0-1 referrals. 5-10%. 10-15%. 75-80%. 23. Where we ended up:. 6+ referrals 2-5 referrals 0-1 referrals. 24.5%. 15.1%. 60.4%. Total Referrals. Last year- 7764

Year End Behavior Data
E N D
Presentation Transcript
Year End Behavior Data Robbinsdale Middle School 2011-2012
23 Optimal: 6+ referrals 2-5 referrals 0-1 referrals 5-10% 10-15% 75-80%
23 Where we ended up: 6+ referrals 2-5 referrals 0-1 referrals 24.5% 15.1% 60.4%
Total Referrals • Last year- 7764 (including blue cards and tardies/skipping/truancy) • This year- 7023 (including tardies/skipping/truancy) • 9.5% reduction
Where do we go from here? • Continue to improve our SW-PBIS Tier 1 system, supporting ALL students: • Continued CPI Training, ENVOY Training & Discipline Plan, CARE Expectations taught and reinforced, CARE cards give out to more students, etc. • Identify students earlier that need more support • Develop systematic Tier 2 and Tier 3 support systems for “yellow” and “red” students