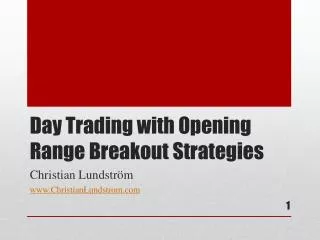
Momentum Breakout Trading
320 likes | 669 Vues
Momentum Breakout Trading . A new look at an old friend. The application of standard deviation bands, Bollinger’s, to price charts to give us buy and sell signals. Standard Deviation Bollinger Bands as taught by John Bollinger. Sell?. ?. ?. Buy?. ?.

Momentum Breakout Trading
E N D
Presentation Transcript
The application of standard deviation bands, Bollinger’s, toprice charts to give usbuy and sell signals
Standard Deviation Bollinger Bands as taught by John Bollinger Sell? ? ? Buy? ?
Unfortunately, Bollinger’s Band settings, give us NO objective buy and sell signals.
Bollinger does suggestusing lots of technical studies to get the reversal points
STANDARD DEVIATION A NORMAL PRICEDISTRIBUTION MEANS THAT MOST OF THE PRICES ARECLOSE TO THE AVERAGE WITHFEW PRICES AT ONE EXTREMEOR ANOTHER AVERAGE PRICEOR“MEAN”
Standard Deviation Bell Curve Bollinger’s Bands BREAKOUTAREASELL BREAKOUTAREABUY AVERAGEPRICE Our MomentumBreakout bands“MOBO” TIGHTER BANS TO SHOW THE BREAKOUT OF PRICE
J. BOLLINGER BANDS MOBOBANDS
LONG LONG SHORT ABOVE MOBO BUYBELOW MOBO SELL
SYMC MOBO BREAKOUT MOBO SUPPORT
SELL GE SELL BUY
MOBOSELLBREAKOUT RSTI MOBOBUY BREAKOUT
ERTS 15 Sma 50 Sma
Two Day Chart ERTS No Sell Signals
2 DAY CHART DJ-30
DJ-30 HOURLY BLUE ‘MEAN’ PRICE AVERAGE
SELL DJ-30 ONE MINUTEWITH BLUE ‘MEAN’
100 Sma BUY EELN WITH MOBO AND SOAP
To be continued