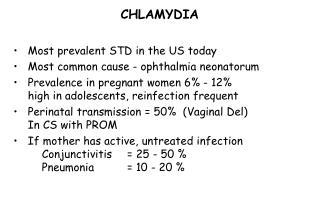
Chlamydia
Chlamydia. 2011 Data. Chlamydia—Rates by Sex, United States, 1991–2011. NOTE: As of January 2000, all 50 states and the District of Columbia have regulations that require the reporting of chlamydia cases. 2011-Fig 1. SR. Chlamydia—Rates by Region, United States, 2002–2011.

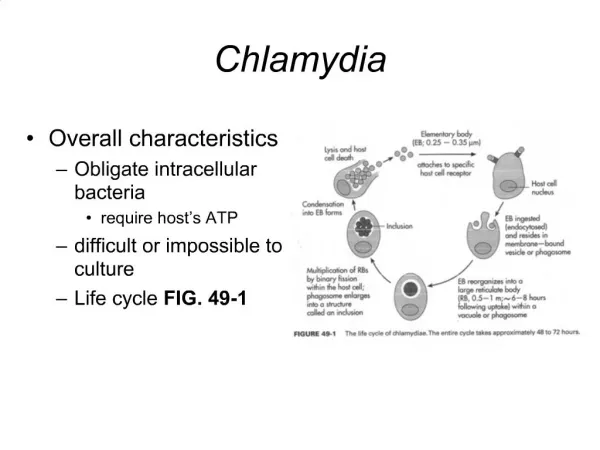
Chlamydia
E N D
Presentation Transcript
Chlamydia 2011 Data
Chlamydia—Rates by Sex, United States, 1991–2011 NOTE: As of January 2000, all 50 states and the District of Columbia have regulations that require the reporting of chlamydia cases. 2011-Fig 1. SR
Chlamydia—Rates by Region, United States, 2002–2011 2011-Fig 2. SR
Chlamydia—Rates by State, United States and Outlying Areas, 2011 NOTE: The total rate of chlamydia for the United States and outlying areas (Guam, Puerto Rico, and Virgin Islands) was 454.1 per 100,000 population. 2011-Fig 3. SR
Chlamydia—Rates by County, United States, 2011 2011-Fig 4. SR
Chlamydia—Rates by Age and Sex, United States, 2011 2011-Fig 5. SR
Chlamydia—Rates by Race/Ethnicity, United States, 2002–2011 2011-Fig 6. SR
Chlamydia—Cases by Reporting Source and Sex, United States, 2002–2011 2011-Fig 7. SR
Chlamydia—Percentage of Reported Cases by Sex and Selected Reporting Sources, United States, 2011 *HMO=health maintenance organization; HD=health department NOTE: These categories represent 70.2% of cases with a known reporting source. Of all cases, 11.2% has a missing or unknown reporting source. 2011-Fig 8. SR
Chlamydia—Proportion of Sexual Transmitted Disease (STD) Clinic Patients Testing Positive by Age, Sex and Sexual Behavior, STD Surveillance Network (SSuN), 2011 *MSM=men who have sex with men; MSW=men who have sex with women only. 2011-Fig 9. SR
Chlamydia—Prevalence Among Persons Aged 14–39 Years by Sex and Survey Cycle, National Health and Nutrition Examination Survey, 1999–2008 SOURCE: Datta SC, Torrone E, Kruszon-Moran D,Berman S, Johsnon R, Satterwhite CL, Papp J, Weinstock H. Chlamydiatrachomatis trends in the United States among persons 14 to 39 years of age, 1999-2008. Sex Transm Dis. 2012Feb;39(2):92-6. 2011-Fig 10. SR
Chlamydia—Prevalence Among Persons Aged 14–39 Years by Sex, Race/Ethnicity, or Age Group, National Health and Nutrition Examination Survey, 2005–2008 NOTE: Error bars indicate 95% confidence intervals. 2011-Fig 11. SR
Chlamydia—Median State-specific Positivity Rates Among Women Aged 15–24 Years Tested in Family Planning Clinics, Infertility Prevention Project, United States, 1997–2011 NOTE: As of 1997, all 10 U.S. Department of Health and Human Services (HHS) regions, which represent all 50 states, the District of Columbia, and outlying areas, reported chlamydia positivity data. 2011-Fig 12. SR
Chlamydia—Positivity Among Women Aged 15–24 Years Tested in Family Planning Clinics, by State, Infertility Prevention Project, United States and Outlying Areas, 2011 *States/areas reported chlamydia positivity data on fewer than 500 women aged 15-24 years in 2011. 2011-Fig 13. SR
Chlamydia—Trends in Positivity Rates Among Women Aged 15–24 Years Tested in Family Planning Clinics, by U.S. Department of Health and Human Services (HHS) Region, Infertility Prevention Project, 2007–2011 2011-Fig 14. SR
Chlamydia—Percentage of Nucleic Acid Amplification Tests Used Among Women Aged 15–24 Years Tested in Family Planning Clinics, by U.S. Department of Health and Human Services (HHS) Region, Infertility Prevention Project, 2007–2011 NOTE: Excludes tests where test type is not specified or otherwise unavailable. 2011-Fig 15. SR