Download
1 / 24
240 likes | 366 Vues
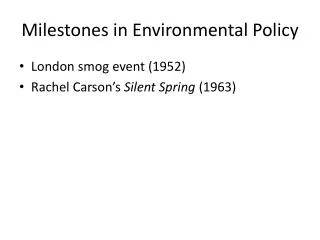
Optimizing Use of Environmental Information in Decision Making: Beta Testing Information Products EEA/USEPA 23 September 2004 Brussels Mary Altalo. Flow Charting Environmental Information in Policy Decisions. OUTCOMES. IMPACTS. DATA. INFORMATION. KNOWLEDGE. ACTION. SOLUTIONS.

E N D
Optimizing Use of Environmental Information in Decision Making:Beta Testing Information ProductsEEA/USEPA23 September 2004BrusselsMary Altalo
Flow Charting Environmental Information in Policy Decisions OUTCOMES IMPACTS DATA INFORMATION KNOWLEDGE ACTION SOLUTIONS
Example: Weather Information “Flow” on the Decision Process and Value Chain in the Utilities Industry INFORMATION KNOWLEDGE ACTION OUTCOMES IMPACTS DATA • scheduling and load balancing • asset management and replacement • enterprise wide contingency and financial planning • demand reduction and price responsive loads • environmental dispatch • congestion management Weather Data Pre- Processing Weather Information Integration Weather Decision Support Weather Information Evaluation Weather Data Collection Weather Data Formatting Operational Decisions Load Forecasting NMS Other Present Value-Added Service Providers • Improved profit • Increased Efficiency • Improved reliability • Increased safety • Decreased Liability • Decreased Risk • Decreased Exposure Short Mid Long term Weather Data Analysis and IT Services: Quantify, source, cost and reduce weather data error Load Model Error Analysis: Improve Software and Support Decision Analysis, Dependencies and Support Tools Economic/ Performance Valuation of Weather Error Impacts
Building Industry Decisions Requiring Environmental Information • Seismic/soil • Air/water Quality • Sea Level/beach • SST • Red tides • Ppt/temp • Storm surge • Winds • Sea breeze • Precipitation • T,humidity,cloud cover, ppt • Air quality • Emissions/air and water • Climate, ppt, temp, winds • Fire risk
The Power of Linking Decision Support Tools to get a Solution Set Severe Weather/Climate/Ocean Forecast + Impact Assessment on Operations + Emergency Power Dispatch Management
Electricity Visualization and Modeling at the Distribution Level is Essential • Using the existing GIS from utilities and state & federal agencies • Import Electrical Data • Identify Critical Customers • Assess Consequences • Improve Mitigation Approaches
The Solution: Linking Weather Forecast Simulation Tools with Emergency Response Simulation Tools for Severe Weather Emergency Energy Management Expert “Grid” Management Situational Awareness and Power Restoration Management Tool Emergency preparedness with “CATS” (consequence assessment tool set) Locate critical energy assets, estimate damage and position for relief Storm Tracking with simulation tool- predict hurricane landfall Data-Information Action and Outcomes Knowledge
“Chem-Bio Weather” Forecasts and Dispersion Models Predict Hazards and Allows Mitigation
Using Environmental Information for Operational And Policy Advantage I. Introduction: • Driving principles for managing with environmental information • Weather/climate impacts on global market segments • Framework A. Framework for Problem Identification Role of weather on business/government processes- Use of environmental information in the business/government value chain , B. Framework for Problem Solving Translating weather data into business or policy solutions • Deriving a Business/ Policy Solution A. From Data to Information Converting data to knowledge process Global Observing System Statistical measurements, pattern analysis B. From Information to Knowledge (of risks and impacts on business/policy performance) Actions to outcomes to impacts to solutions Economic valuation of weather risk Assessing vulnerability to risk Diagnostic approach to assessing vulnerability Managing information to hedge risk C. From Knowledge to Action/Decision • Strategic decisions • Re-engineering business processes for managing with environmental information Leadership issues • Planning decisions • Risk hedging financial/insurance decisions • Tactical Decisions • Selecting decision tools (was “producing a decision tool”) • Scenario analysis--Academic reading: Decision trees • Linking decision tools to get a solutionCase: Western Energy D. Implementation and Evaluation • The audit process • Satisficing/ scrutiny
Topics Introduced • Driving Principles for Managing with Environmental Information • Weather/Climate Impacts on Global Market Segments • Role of Weather on Business Processes • Use of Environmental Information in Business Value Chain • Translating Weather Data into Business Solutions • Converting Data to Knowledge Process • Global Observing System Data • Economic Valuation of Weather Risk • Assessing Vulnerability to Risk • Diagnostic Approach to Assessing Vulnerability • Managing Information to Hedge Risk • Re-engineering Business Processes for Managing with Environmental Information • Leadership Issues • Risk Hedging financial/insurance decisions • Selecting a Decision Tool • Scenario Analysis • Linking Decision Aids to get a Solution Set • The Audit Analysis • Satisficing/ Scrutiny- when is there enough information
Planning Area Planning Area Planning Area Level of Analysis: Level of Analysis: Level of Analysis: Scenario Scenario Scenario Inter Inter Inter - - - /Intra Regional /Intra Regional /Intra Regional Distribution Distribution Distribution End End End - - - customer customer customer Task 1. Task 2. Task 3. Base Case Gap Analysis Cost - Benefit Situation Assessment • Apply “Perfect Case” • Identify costs and benefits • Project Initiation • Identify Gaps • Review and select methodology • Define Current Practice • Evaluate NOAA Prototypes • Apply Methodology • Define Planning Needs • Recommend Ideal/Most • Evaluate current data • Optimal Product Strengths and weaknesses Energy Planning Requirements Planning Requirements Planning Requirements Planning Requirements • • Load forecast Load forecast • • Load forecast Load forecast • • Short Short - - term pricing term pricing • • Short Short - - term pricing term pricing • • Load flow management Load flow management • • Load flow management Load flow management • • Power purchases Power purchases • • Power purchases Power purchases Task 1. Task 1. Task 2. Task 2. Task 3. Task 3. Project Objectives Project Objectives Base Case Base Case Gap Analysis/Test Case Gap Analysis Cost Cost - - Benefit Benefit Project Objectives Project Objectives Situation Assessment • • Apply “Perfect Case” Apply “Perfect Case” Situation Assessment • • Identify costs and benefits Identify costs and benefits Identify optimal NOAA Identify optimal GOOS • Project Initiation • • Identify Gaps Identify Gaps • • Review and select methodology Review and select methodology Identify optimal NOAA Identify optimal NOAA • • Define Current Practice Define Current Practice product definitions supporting product definitions supporting • • Evaluate NOAA Prototypes Evaluate GOOS Prototypes • • Apply Methodology Apply Methodology product definitions supporting product definitions supporting • • Define Planning Needs Define Planning Needs the industry planning Energy industry planning • • Recommend Ideal/Most Recommend Ideal/Most Energy industry planning Energy industry planning • • Evaluate current data Evaluate current data requirements requirements • • Optimal Product Optimal Product requirements requirements Strengths and weaknesses Strengths and weaknesses Data Providers Data Providers (NOAA NWS, OAR, Practitioners Practitioners (Eurogoos,ECMWF Practitioners Practitioners ARL, FSL,, EPA, Panel Panel NWS, Ifremer, Panel Panel NCEP, NASA) • • BP NE ISO NCEP, ODIN Data Intermediaries Data Intermediaries Environmental Information • • NE ISO NE ISO (EarthSat, WNI, AWS) • • Scottish Power Con Edison • • Con Edison Con Edison Supply Curve Supply Curve • • Starwood PJM • • PJM PJM • • SUNY BRE • • SUNY SUNY Not Attractive Not Attractive Products Products Attractive Attractive Cost Cost Products Products Marginal Marginal Benefits/Decisions Benefits/Decisions