Download
1 / 1
10 likes | 156 Vues
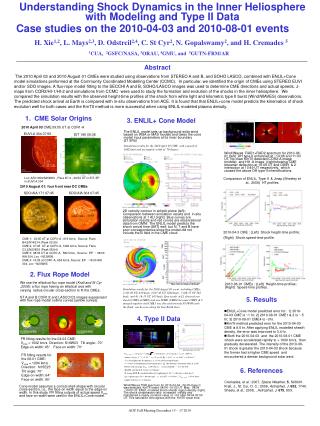
Understanding Shock Dynamics in the Inner Heliosphere with Modeling and Type II Data Case studies on the 2010-04-03 and 2010-08-01 events. H. Xie 1,2 , L. Mays 2,3 , D. Odstrcil 2,4 , C. St Cyr 2 , N. Gopalswamy 2 , and H. Cremades 5. 1 CUA, 2 GSFC/NASA, 3 ORAU, 4 GMU, and 5 GUTN-FRM/AR.

E N D
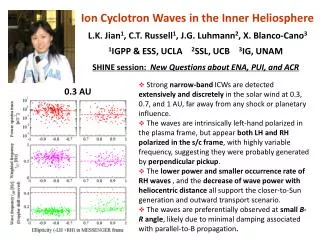
Understanding Shock Dynamics in the Inner Heliosphere with Modeling and Type II Data Case studies on the 2010-04-03 and 2010-08-01 events H. Xie1,2, L. Mays2,3, D. Odstrcil2,4, C. St Cyr2, N. Gopalswamy2, and H. Cremades 5 1CUA, 2GSFC/NASA, 3ORAU, 4GMU, and 5GUTN-FRM/AR Abstract The 2010 April 03 and 2010 August 01 CMEs were studied using observations from STEREO A and B, and SOHO LASCO, combined with ENLIL+Cone model simulations preformed at the Community Coordinated Modelling Center (CCMC). In particular, we identified the origin of CMEs using STEREO EUVI and/or SDO images. A flux-rope model fitting to the SECCHI A and B, SOHO/LASCO images was used to determine CME directions and actual speeds. J-maps from COR2/HI-1/HI-2 and simulations from CCMC were used to study the formation and evolution of the shocks in the inner heliosphere. We compared the simulation results with the observed height-time profiles of the shock from white light and kilometric type II burst (Wind/WAVES) observations. The predicted shock arrival at Earth is compared with in-situ observations from ACE. It is found that that ENLIL+cone model predicts the kinematics of shock evolution well for both cases and the KmTII method is more successful when using ENLIL modeled plasma density. 1. CME Solar Origins 3. ENLIL+ Cone Model 2010 April 03 CME:09:05 UT at COR1-A The ENLILmodel sets up background solar wind based on WSA or MAS models and takes the cone model input parameters at its inner boundary (21.5Rs) EUVI-A 304 07:56 EIT 195 05:36 Simulation results for the 2010 April 03 CME with a speed of 1002 km/s and an angular width of 70 degree. Wind/Waves RAD1+RAD2 spectrum for 2010-08-01 (left). DH type II enhanced at ~10:06 and 11:03 UT. No clear KmTII detected.COR2-A image (middle) and HI1-A image (right)showing CME streamer deflection at 10:09 UT and CME1 & 2 interaction at 10:49 UT respectively, which caused the above DH type II intensifications. Flare: B7.4 S25W03 STA EP S to AR 11059 F Loc: AR11059/S25W03 , Flare B7.4 , 09:54 UT in EIT, EP in EUVI-A 304 Comparison of ENLIL, Type II & Jmap (Sheeley et al., 2008) HT profiles 2010 August 01: four front near DC CMEs SDO/AIA 171 07:45 SDO/AIA 304 07:45 H CME3 2D velocity contour in ecliptic plane (left); Comparison between simulation results and in-situ observations at 1 AU (right). Blue curves are simulation results and red curves are observational data from OMNI. The ENLIL model predicts the shock arrival time (SAT) well but N, T and B have poor correspondence since the model did not include the B field in the CME cloud. CME4 CME2 CME1 FLR: B4.5 N14E14 FLR: C3.2 N20E36 CME 2010-04-3 CME : (Left) Shock height-time profile; (Right) Shock speed-time profile. CME 1: 03:05 UT at COR1-A , 619 km/s, Source: Flare B4.5/N14E14 (Peak 03:50) CME 2: 07:45 UT at COR1-A, 1284 km/s, Source: Flare C3.2/N20E36 (Peak 08:54) CME 3: 08:35 UT at COR1-A, 582 km/s, Source: EP ~ 08:00 AIA 304, Loc ~N33W08 CME 4: 16:35 at COR1-A, 655 km/s, Source: EP ~16:00 AIA 304, Loc ~N20W05 2. Flux Rope Model We use theelliptical flux rope model (Krall and St Cyr ,2006): a flux rope having an elliptical axis with varying radius circular cross-section to fit the CMEs. 2010-08-01 CMEs : (Left) Height-time profiles; (Right) Speed-time profiles. Simulation results for the 2010 August 01 event, including CMEs: 1) 03:05 UT, 619 km/s; 2) 07:45 UT 1284 km/s; 3) 08:35 UT 582 km/s; and 4) 16:35 UT, 655 km/s. Spacecraft at L1 detected one shock (CME1+CME2) and one ICME (CME4) because CME1 & 2 merged together and CME3 was directed towards N33W08 (only the flank can be seen along the Sun-Earth line). 5. Results ST A and B COR1/2 and LASCO/C2 images superposed with flux-rope model outline curves (yellow curves). • ENLIL+Cone model predicted error for: 1) 2010- • 04-03 CME is ~1 hr; 2) 2010-08-01 CME1 & 2 is ~.5 hr; 3) 2010-08-01 CME4 is ~3hr. • KmTii method predicted error for the 2010-04-03 CME is 8.5 hr. After applying ENLIL modelled sheath density, the error was improved to 3.4 hr. • Both the 2010-04-03 and the 2010-08-01 CME /shock were accelerated rapidly to > 1000 km/s, then gradually decelerated. The intensity of the 2010-08-01 shock is greater the 2010-04-03 shock because the former had a higher CME speed and encountered a denser background solar wind. 4. Type II Data FR fitting results for the 04-03 CME: Vcme = 1002 km/s Direction: S18W03 Tilt angle: -70 Edge-on width: 45 Face-on width: 70 FR fitting results for the 08-01 CME: Vcme = 1284 km/s Direction: N15E25 Tilt angle: 70 Edge-on width: 64 Face-on width: 90 6. References Cremades, et al.: 2007, Space Weather, 5, S08001. Krall, J., St. Cyr, O. C.: 2006, Astrophys. J.652, 1740. Sheely, et al.: 2008, , Astrophys. J.675, 853. Wind/Waves TNR spectrum for 2010-04-04 . No DH type II was detected. KmTII onset: 04/04 ~01:00 UT Max: 04/04 ~16:00 UT. ENLIL modeled shock sheath region density (right). The shock compression ratio increased initially and maintained a nearly constant value of ~4.0 after 04/04 00:00 UT. This saturation time agrees with the KmTII onset time. Cone model assumes a conical shell shape with circular cross-section, i.e., the face-on width equal to the edge-on width. In this study, FR fitting outputs of actual speed Vcme and face-on width were used in the ENLIL+Cone model. AGU Fall Meeting December 13 – 17 2010