Download

1 / 34
500 likes | 1.53k Vues
EMBA 514 Capital Structure Theory. Capital Structure Effects on Value. The impact of capital structure on value depends upon the effect of debt on: WACC Feedback to FCF. Cost of Equity effect.

E N D
Capital Structure Effects on Value • The impact of capital structure on value depends upon the effect of debt on: • WACC • Feedback to FCF
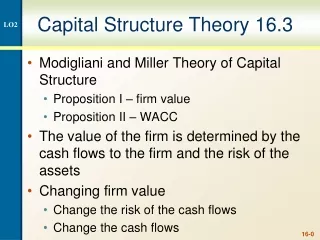
Cost of Equity effect • In seeking to minimize the WACC, firms trade-off the benefit of using more lower cost debt against a rising cost of equity • We need an equation for how the cost of equity might be expected to behave as debt increases • The Modigliani and Miller model provides a framework for estimating the cost of equity at different capital structures
Modigliani and Miller Assumptions • No taxes • All debt is riskless, so the cost of debt is constant • no possibility of default • Capital structure has no impact on operating cash flows • No agency costs • No information asymmetry • Perpetual cash flows
In MM Enterprise Value depends entirely on level and volatility of EBIT Current Assets - Oper. Current Liab. PP&E Debt Equity Net Working Capital Capital investment generates EBIT = Free Cash Flow here Same EBIT, same risk (WACC), same Enterprise Value
MM Proposition 1 with Zero Taxes • Under the previous restrictive assumptions, we can argue that two firms with the same EBIT and variance in EBIT (‘operating risk’) should have the same Enterprise Value (Debt + Stock) • VL =VU = EBIT capitalized at WACC (zero growth and no tax, so EBIT=NOPAT=FCFF) For an unlevered company, the cost of equity (rsU) is the same as WACC, since the capital structure is 100% equity
MM Proposition 2 with Zero Taxes • The cost of equity of a levered firm (rsL) is equal to the cost of equity of an unlevered firm plus a risk premium which depends on the degree of financial leverage. • Reductions in capital costs as a result of using more lower cost debt (rd) are exactly offset by increases in the cost of levered equity (rsL) due to added financial risk. • As a result the WACC is constant at all debt levels, as is Enterprise Value (V) proof shown below
Proposition 2 equation for the levered cost of Equity (see MM example in Excel) For a zero-growth company with no taxes, Free Cash Flow to Equity = Net Income = EBIT – Interest Expense = EBIT - rdD (1) From Proposition 1 (2) EBIT = Return to capital x Capital Substitute (2) into (1) This is the Proposition 2 equation
MM Proposition 2: No taxes Cost of Capital (%) rs WACC rsU rd Debt/Value Ratio (%)
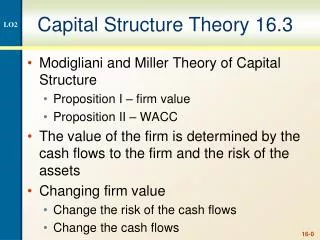
MM Proposition 1 with Taxes • The value of an unlevered firm is equal to EBIT (1-T) capitalized at the cost of equity • The value of a levered firm is equal to the value of an unlevered firm of the same risk class, plus the value of the interest tax savings capitalized at the cost of debt
MM Proposition 2 with Taxes • The cost of equity of a levered firm is equal to the cost of equity of an unlevered firm plus a risk premium which depends on both the degree of leverage and the corporate tax rate.
MM Proposition 2 with Taxes (1) The no-tax eq (1) with taxes Rearrange (1) (2) From proposition 1 Rearrange (3) Rearrange Substitute (3) into (2) for EBIT(1-T) Rearrange
MM Proposition 2 with Taxes (4) Last equation from prior slide (5) Value = Stock + Debt Substitute (5) into (4) Factor out D/S This is Proposition 2 with taxes
MM Proposition 2 with Taxes Risk premium now includes (1-T) • rsL increases with leverage at a slower ratewhen corporate taxes are considered. • Taxes are an additional variable cost that reduce the variability in cash flow. • The government now shares in the risk of the cash flows. • The WACC continues to decline as new debt is added, and entity value continues to rise. Pile on the debt!
MM Proposition II: With taxes Cost of Capital (%) rs rsU WACC rd(1 - T) Debt/Value Ratio (%)
MM relationship between value and debt with taxes Value of Entity, V (%) VL TD VU VU Debt VL = VU + TxD
Adjusting Beta for Capital Structure Effects • In practice, the effect of capital structure on the Equity cost of capital is recognized by adjusting Beta in the Capital Asset Pricing Model • MM theory implies that beta increases with leverage • As firms borrow, they create fixed costs (interest payments) that make their cash flows to equity investors more volatile (financial risk) • This increased earnings volatility increases the equity Beta • Need equation for beta as a function of leverage • Hamada’s Equation
Hamada’s Equation CAPM equation for a levered firm CAPM equation for an unlevered firm Riskless debt assumption Proposition 2 Substitute levered CAPM in left side of Proposition 2 and unlevered CAPM in right side: Cancel the rRF and divide by (rM-rRF) Hamada’s Equation
Trade-off Theory • MM theory assumes away financial distress costs, which increase as more leverage is used: • Higher debt costs, including negotiation and monitoring by creditors (MM assume constant cost of debt) • Feedback to Free Cash Flow • Rejection of +NPV investments (under-investment) • Growth prospects suffer as business reduces R&D and Marketing expenditures • Loan covenants, which constrain growth • Fire sales of assets to raise cash • Lost customers, suppliers, and employees • Investment in Capital increases as lose trade credit • Contradicts assumption of MM that capital structure doesn’t effect operating cash flows Growth
Trade-off Theory (cont.) • Trade-off theory suggests optimal capital structure is reached at point where marginal distress costs exceed the marginal tax benefit from adding debt in the MM model. • At this same point the WACC is minimized and entity value is maximized.
Trade-off tax shield against distress costs VL VL = VU + TD Distress costs Max VL VL = VU + TD – distress VU VL = Total value with debt VU = Total value with no debt T = Tax rate D = Debt Debt Optimal Debt Level
Trade-off theory suggests these types of firms will use more debt (least impacted by financial distress) • Low growth opportunities (predictable funds needs and less risk of jeopardizing growth investments) • High and stable free cash flow • Large size (safety and lower growth) • Marketable collateral (less service or R&D intensive) • Product not subject to ongoing maintenance/warranties, observable quality • Profitable enough to benefit from tax shelter
Debt can reduce Equity Agency Costs • Equity agency problemis that managers might: • use corporate funds for non-value maximizing purposes (e.g. perks, acquisitions, value-destroying growth) • or seek low risk due to undiversified interest in firm • Problem is most significant in large firms with diffuse stockholders where management ownership is low
Debt can reduce Equity Agency Costs (cont.) • The use of financial leverage: • Bonds free cash flow for firms generating more cash than required to fund +NPV opportunities, reducing perk consumption and value-destroying growth. • Increases free cash flow by forcing efficiencies: failure risk gets managers’ attention
Signaling Theory • MM assumed that investors and managers have the same information. • Where significant information asymmetries exist, stockholders assume: • Stock issues may indicate lower expected FCF, unwilling to commit to increased debt service • Company issues new stock when it is overvalued • Bonds are issued when stock is undervalued • Leverage-decreasing events signal overvalued stock, and vice versa, supported by empirical data
Signaling theory results in Pecking Order Hypothesis • Firms will choose the following sequence of funding sources to maintain financial flexibility and avoid negative signals • Retained earnings • Excess cash • Debt issuance • Stock issuance • Maintenance of borrowing capacity is most important for high-growth firms, where value depends on the ability to fund growth investments Maintain borrowing capacity
Evidence on Signaling Theory • Profitable firms use less debt (surprise) because they can build more equity internally • Contradicts Trade-off theory which suggests they should have high debt due to low default risk and need for tax shelters • Suggests capital structure decision is a residual that depends on cash flow, and the investment and distribution decisions • Mature firms issue stock very infrequently
Steps in the distribution decision How many + NPV investments? Reinvestment: Capex + Working Capital How much will you borrow? How much cash on Balance Sheet? CF to Debt: Principal + Interest NOPAT Free Cash Flow Cash held on Balance Sheet Cash flow available to stockholders Cash paid out Repurchases Dividends Which type of distribution? Suggest stock repurchases are a residual from the FCF forecast
Evidence on Signaling Theory (cont.) • When setting capital structure targets, survey evidence indicates managers consider, in rank order: • Financial Flexibility • Long-term survival • Maintenance of predictable funds sources • Maximization of stock price • Suggests concerns over feedback to operating performance
Summing the theories This leaves us with: VL = VU + tax benefit – financial distress + equity agency + signaling Capital structure decision requires judgment!
Practical approach to quantifying capital structure choice See Excel example Use Hamada’s equation to estimate changes in cost of Equity Use credit ratios to estimate changes in cost of debt Find weights where WACC is minimized Compare result to peers and use judgment to incorporate the other factors: 1) financial distress; 2) agency; 3) signaling
Additional considerations in setting the target capital structure • Effect on sustainable growth: willingness to increase debt allows for higher growth rate today Sustainable g = ROE x (1 – Dividend Payout Ratio)ROE = ROIC + [ROIC - rd(1-t)] x D/E Example of target D/E given target growth:Dividend payout = 40%; Target growth = 15%;ROIC = 12%; rd(1-t) = 5.5% Required ROE = g ÷ (1-DPR) = .15 ÷ (1-.40) = 25%Required D/E = (25% - 12%) ÷ (12% - 5.5%) = 2.0 See Excel example
Additional considerations in setting the target capital structure (cont.) Lender and rating agency attitudes(impact on credit ratings) Debt ratios of other firms in the industry Risk aversion of managers Intersection with distribution policy
Additional considerations in setting the target capital structure (cont.) • Use debt to retain control and avoid takeover • Realize value of tax shield to boost stock price • Concentrate ownership in friendly hands • Signal operating improvements that will lead to increased profit and stock price • Signal strategy to disgorge excess FCF