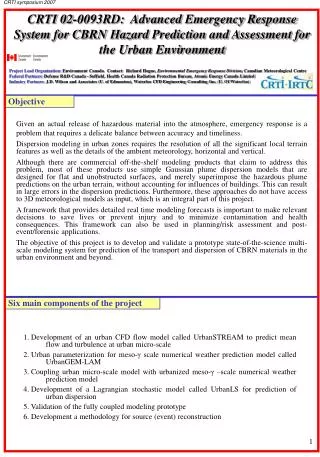
Research Ethics Symposium 2007
Research Ethics Symposium 2007. H. F. Gilbert, Ph.D. Assoc Dean for Academics and Postdoctoral Research Graduate School of Biomedical Sciences. Clinical Ethics Symposium (May 21-24). Resources List. Ethics Training Site http://www.bcm.edu/gs/ethics/index.html. On Being a Scientist

Research Ethics Symposium 2007
E N D
Presentation Transcript
Research Ethics Symposium 2007 • H. F. Gilbert, Ph.D. • Assoc Dean for Academics and Postdoctoral Research • Graduate School of Biomedical Sciences
Resources List Ethics Training Site http://www.bcm.edu/gs/ethics/index.html On Being a Scientist http://www.nap.edu/readingroom/books/obas/content.html Statistics on Line http://www.statsoftinc.com/textbook/stathome.html
The Scientific Method & Scientific Integrity Truth Observations Hypothesis or Model falsifiable Predictions controls Experiments
Error in Experiments • Random error - error that cannot be controlled • pipetting error (2-10%) • temperature variations • biological variability • lot to lot differences in reagents • measurement errors (instrumental errors)
Error in Experiments • Systematic error -errors that occur consistently within the same experiment(s) • instrument calibration errors • reagent concentrations based on weight or incorrect measurement in stock solutions • systematic losses of material • biological variability - variation between strains
Error in Experiments • Blunders -catastrophic errors that occur occasionally • swapping sample identity • adding the wrong reagent • failing to add something • biological variability - variation between strains
What would you do? Sharon, a graduate student, was putting her thesis together, and constructing a table of doubling times for a series of experiments to determine the effects of glucose vs galactose as a carbon source on a mutant strain of yeast. She was looking for mutations in the galactose transporter that would decrease the import of galactose and make it harder for the cells to grow on galactose but not glucose. In a growth screen, she found one cell line that grew more slowly on galactose than glucose. She has been working the past year on identifying the site of the mutation and has recently found a point mutation in the galactose transporter in this strain.
What would you do? When writing up the paper for publication her PI wanted to include the actual doubling time of the strain on glucose and galactose. When she looked back in her notebook, she found that she had measured the growth rate for this strain only once. For wt yeast, growth rates on glucose and galactose are usually similar. Since the growth on glucose and galactose medium was so different, Sharon was sure that her conclusion that the mutation caused the slow growth was right. However, she and her PI wanted to be sure of her result so she decided to repeat the measurement.
She repeated the measurements the next day and obtained the following results. Now what? Original Data All Data 2nd expt
What if the experiments had come out this way? Would she have been finished? How many times should you repeat an experiment to be certain of the results? Original Data All Data
The t-test Lets you statistically test to see iftwo means differ significantly Raw Data Mean1 - Mean2 mean stdev 1 1 12 (n1-1)+22(n2-1) ( n1 n2) n t = + (n1+n2 -2)
How many experiments to you have to do to make up for your mistake? Can you ever?
(Suspect - Nearest Point) Q > = (High Point - Low Point) Outliers Throw out when Q 0.66 0.86 0.66 0.86 0.53 0.81 Throw out when greater than 2 away from average 2 2.6-5.0 1.3-5.7 2.9-4.9 1.1-5.1 2.8- 5.2 1.1-4.7
Graphical Data and Correlations Outliers can affect data drastically. Failing to exclude a true outlier can bias your data. Excluding a false outlier can also bias your data. IF YOUR CONCLUSION CHANGES WHEN YOU INCLUDE OR EXCLUDE A POINT - YOU NEED MORE POINTS.
Confidence Interval Testing of Data Points Linear Fit of DATA1_B 45 45 Linear Fit of DATA1_B Upper 95% Confidence Limit Upper 95% Confidence Limit 40 Lower 95% Confidence Limit 40 Lower 95% Confidence Limit 35 35 30 30 25 25 Absorbance Absorbance 20 20 15 15 10 10 5 5 0 0 0 1 2 3 4 0 1 2 3 4 Concentration Concentration Y = A + B * X Parameter Value Error ------------------------------------------------------------ A 8.42857 4.4964 B 4.50714 1.74145 ------------------------------------------------------------ R SD N P ------------------------------------------------------------ 0.69928 6.86837 9 0.03604 ------------------------------------------------- Y = A + B * X Parameter Value Error t-Value Prob>|t| --------------------------------------------------------------------------- A 5.41667 1.3934 3.88739 0.0081 B 6.91667 0.59415 11.64136 <0.0001
Outliers If you are sure of a blunder record it in your notebook and eliminate it from consideration. Being sure means that you are positive that you made a mistake and can document it, not simply that the results are not what you expect Rule of thumb is that you should not remove more than one outlying point from a given data set Each field/PI may have different standards for how data are selected for inclusion. However, if data are excluded it should be stated in the paper, including the criteria that were used.
What would you do? Tom is investigating how vitamin E protects cells against oxidative stress. He is examining how a human HeLa cell line responds to hydrogen peroxide treatment. Using an antibody to superoxide dismutase he used a western blot of extracts from HeLa cells to observed the amount of SOD present after peroxide treatment in conjunction with vitamin E, a known antioxidant.
How should Tom present his data? H2O2 Vit E - + + - + - + - - + + - + - + - - + + - + - + - Original Data Contrast enhanced Cropped
What would you do? Mai is trying to determine how well a protease activated at the G2-M transition of the cell cycle clips and inactivates a downstream cell cycle repressor. She treats the purified repressor with a small amount ofher purified protease, waits 10 min and detects the repressor fragments with a polyclonal antibody. She performs the Western blot and probes with her antibodyand then a second antibody to visualize the protein by ECL.
Which exposure time is the best representation 5s 10s 30s 60s 3min 20 min 1hr
What would you do? Howard is trying to knock out the gene for thioredoxin in a mouse model. Thioredoxin is one of two cofactors for ribonucleotide reductase, which is responsible for making deoxyribonucleotides for DNA synthesis. Thioredoxin is also thought to have other cellular functions. After verifying the genotype in his first generation mouse, Howard breeds a male and female heterozygote and examines the genotype of the offspring.
Howard obtained the following results.What would you conclude?How sure are you?
Can test statistical significance or use “rules of thumb” established by experience
Natasha wanted to make a mutant of a protein kinase that was already known to become fully active when auto-phosphorylated on a Ser102. If this amino acid is mutated to Glu, it mimics the phosphorylated serine residue and keeps the kinase constantly active. She wanted to express the constitutively active kinase to examine the inactivation mechanisms in mammalian cells. What should she do to confirm that the kinase is a mutant?
GlyArgCysTrpAlaSerLysAlaWT ACGTAACCGTAGCCGTACTCTACT ::::::::::::::::*:::::::Mut ACGTAACCGTAGCCGTCCTCTACT How sure are you that she has the right mutation? What would you do to be sure that you had the mutation. How can you be sure that you have no other mutations in the protein?
Summary Selecting which data to believe and use is an integralpart of an experiment There are ways (statistical and traditional) to maximize theprobability that you will draw the correct conclusions from your experiments. In your notebooks and any papers/grants derived from them, be sure to state how many times a given experiment was done and give some estimate of how accurate and precise your data are.