Enhancing Construction Quality with Best-Value Systems: PBSRG Overview
Established in 1994, PBSRG aids clients in improving construction quality through research and innovative models. Our work emphasizes Information Measurement Theory (IMT) to forecast future outcomes and implement the Best-Value Performance Information Procurement System (PIPS). With over 800 projects worth $4.6 billion, we drive organizational transformation in project management and risk management using deductive logic. PBSRG's globally recognized research ensures a 98% on-time, on-budget satisfaction rate, establishing us as a leader in the field.


Enhancing Construction Quality with Best-Value Systems: PBSRG Overview
E N D
Presentation Transcript
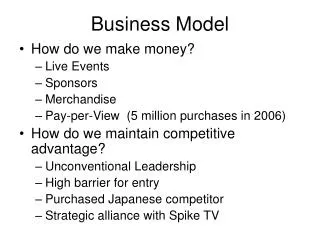
Best Value Business Model www.pbsrg.com
Who we are: PBSRG Overview • Established in 1994 to assist clients in improving the quality of construction. • Research has grown into: • Information Measurement Theory (IMT): measuring of current conditions to predict future outcomes • Clients implementation of Best-Value Performance Information Procurement System (PIPS) • Organizational Transformation Models • New project management model (alignment/leadership instead of management/influence) PIRMS • New best value model • New information environment (minimize access and flow of information) • Testing of concepts outside of construction • Risk management by using deductive logic, minimization of decision making
PBSRG’s Research Results(Performance Based Studies Research Group) • Worldwide as a leader in Best-Value Systems • Conducting research since 1994 • 168 Publications • 800+Projects • $4.6 BillionServices & Construction • 5% Increase in Vendor profit • 98% On-time, On-Budget, Customer satisfaction • PMI, NIGP, IFMA, IPMA • Tests in Netherlands, Botswana/Africa, Malaysia • ASU – investments of over $100M due to BV
General Dynamics University of Minnesota General Services Administration (GSA) US Solar Heijmans, Netherlands Ministry of Transportation, Netherlands State of Alaska University of Alberta State of Oklahoma State of Idaho Idaho Transportation Department State of Oregon Arizona Parks and Recreation US Army Medical Command USAF Logistics Command University of New Mexico University of Idaho EVIT School District Arizona State University US Corps of Engineers Arizona Public Service (APS) Salt River Project (SRP) Rochester Utility Boise State University Idaho State Lewis & Clark City of Phoenix, AZ City of Peoria, AZ City of Roseville, MN Olmstead County, MN Fann Environmental Brunsfield Fulbright Program /University of Botswana, Africa US Embassy, Bank of Botswana RMIT, Melbourne Australia Aramark, Canon, Qwest, ISP, HP, Chartwells, AP, Pearson Various Contractors and Consultants Research Clients
Working Commission 117 & JournalInternational Efforts & Partners 5 years 15 tests for infrastructure Two major GCs Tongji University Brunsfield Complete Supply Chain Fulbright Scholar University of Botswana PIPS tests RMIT Teaching IMT PBSRG platform
Rules of this Discussion • This is a deductive presentation • Don’t take anything personal!!! • Recommend that you minimize decision making (if you don’t know, use the deductive logic) • Type A and Type C will be discussed. Neither is better than the other. Both are required. Both are just as important as the other.
Information Measurement Theory • IMT Definition: • Measurement of information to predict future outcomes • IMT Objectives: • To minimize the need for decision making • To understand why things happen • To be able to predict future conditions • To minimize the need for data • To optimize results
PRESENT PAST FUTURE 100% Laws 100% Laws 100% Laws LAWSThe Number of Laws of Physics = = Laws are not created…they are discovered
An Event Final conditions Initial conditions Time
Proposal: The Event Can Only Happen One Way Initial conditions Final conditions Time
Deductive Logic • No event has had two outcomes • All event outcomes can be predicted with “all information” (initial conditions/laws) • The more information we have before the event, the easier it becomes to predict the final outcome. • The lack of information that an individual has, will never change the final outcome (it will just prevent that individual from predicting the outcome).
Things caused by a lack of information • Believe in chance • Expectations • Believe in control • Makes decisions • Directs others • Influences others
Cycle of Learning Perceive 100% Information Process Change Apply
Learning SpeedsAll Individuals Learn At Different Speeds Perceive 100% Information Process Change Apply
More “perceptive” perceive at a faster rate, change at a faster rate, and are more accurate with their predictions.
All individuals and organizations have a level of perception that allows them to predict “some” future outcomes.
A B C “Types” of Individuals 100% Perceive 100% Information Change Process Perception of Information Apply 0% Time
A simple model is easy to understand Simplicity is when things look very different Eliminate all areas where things look alike (needs too much decision making) Extremes minimize the decision making To Understand the “A” and the “C” Simplify the Rate of Change Model 100% A B1 Perception of Information B2 C 0% Time
Simplicity: Who perceives more information? 100% A Perception of Information C 0% Time
Type “A” Individual vs. Type “C” Individual • Aligns resources • Makes decisions • Flows more information • Influences • Wants a favor • Doesn’t document • Preplans • Shifts blame to others • Likes to make decisions • Does not prioritize • Uses five words for every one needed A 100% A C C C C Information Level C A C C C C 0% C Time
Type “A” Individual vs. Type “C” Individual • Aligns resources • Very detailed work • Proud of technical skills • Is more expensive • Wants consensus • Likes doing totally new things • Does things they understand • Requests details • Traditional practices • Thinks other people act differently • Believes experts have risk A 100% A C C C C Information Level C A C C C C 0% C Time 22
Type “A” Entity vs. Type “C” Entity 100% • Knows who to work with • Implements leadership training • Measurement of performance • Uses dominant information • Measures • Has a conservative plan • Constantly changes their mind • Use relationships A A C A A Information Level A A C C C 0% Time
RS LS How to Create a KSM Left Side (LS) (Type A) vs. Right Side (RS) (Type C) 100% LS RS A + = Information Level C 0% Time
Where is Control? LS RS 100% A No Control Information Information Level Control No Information C 0% Time
Where is Management? LS RS RS 100% A No Control Leadership Information Information Level Control Management No Information C 0% Time
Decision Making? LS RS RS RS 100% A No Control Leadership Information No Decision Making Information Level Decision Making Control Control Management No Information C 0% Time
Leadership Alignment Efficiency Change the behavior of others Believe in chance Emotion Becomes the expert in the organization Technical Continuous Improvement Freedom Believes in range/diversity Proactive Plot the Following Characteristics LS LS LS RS RS RS RS RS LS LS LS LS LS RS
Logical Overview/Process Details Focuses “why” Focuses “what” Measures Performance Accountable Reactive Telescope “in and out” “What if” Maximize information flow Loves meetings Plot the Following Characteristics LS LS RS LS RS LS LS RS LS RS RS RS LS RS
Does not believe in being controlled Captain of their own ship Can change others “Source of Light” or wisdom to influence all “Mirror” so others can see themselves Can influence anyone Believe in randomness No control over their destiny Feels controlled More activity Incentives Looks inside to improve environment Has a more conducive environment to change Plot the Following Characteristics LS LS RS RS LS RS RS RS RS RS RS LS LS LS RS
Conclusions • The environment is the person • All characteristics can be related to the amount of information • By using extreme values, deductive logic can be used • Type A characteristics are related • To move to a Type A environment, we must minimize Type C characteristics
Questions • Is there anything that happens that is not predictable? • Does anything happen by chance (was not predictable if all the information was known)? • Who is more important to the event, the A or the C? • Is there a random event that has been identified by science? • Why do people like complexity? • Who makes more decisions?
Cycle of Learning Perceive 100% Information Process Change Apply
Q: When do we know 50% of what we will ever know? 0% Information 100% Information 50% Information? 50% Information? 50% Information? Life Span
Proposal: When we are almost dead. 100% Information (what we will know) 0% Information 50% Information Life Span
Q: How much do we know about everything? 0% Information 100% Information This Much? This Much? This Much? % Known
Proposal: We don’t know very much As for me, all I know is that I know nothing. - Socrates 0% Information 100% Information What we don’t know What we know % of Information
Q: How do we solve what we don’t know? (aka Risk) • Do we use what we know to solve what we don’t know? OR • Do we use logic to solve what we don’t know? 0% Information 100% Information What we don’t know What we know % of Information
A: Logic can be applied without knowledge/experience 0% Information 100% Information What we don’t know Logic % of Information
What is the model? • Identify the expert with as little effort as possible, using measurement and differential • Transfer risk and control to the expert through preplanning and risk minimization, focusing on risk that are not controlled • Hire the expert • Use alignment, planning, & measurement in place of management, control, and direction • Create a performance information environment to drive accountability and change • Proactive vs. Reactive • Supply chain (us mentality) • Logic vs. Experience • Predictable vs. Chance
Industry Performance and Capability Vendor X Customers Highly Trained Outsourcing Owner Partnering Owner Medium Trained Minimal Experience Price Based
An Event Initial conditions Final conditions Laws Laws Time Risk is deviation from expected measurements
Traditional Management Initial conditions Final conditions D1 M&C Laws Laws Time • D1: Client makes decisions on budget, time, and expectation • D2: Client consultant/professional makes more decisions to make expectations true • D3: Vendors attempt to use the lowest possible price to minimize the risk caused by the decision making of client & consultant/professional • M&C: The client attempts to force vendor to make expectations happen D2 D3
New PM and RM Model that Depends on Efficiency Initial conditions Final conditions M4 D1 M3 Laws Laws Time • M1: Measured designed option that more accurately describe the initial conditions replaces D1 • M2: The best value vendor that replaces the client/professional design M1 • M3: WRR/RMP measures deviation • M4: Final performance measurement M1 M2
Micro-Management Performance dictated by technical information Specification is the requirement Inspection by client Client’s professional is the expert and has control No performance measurements Increase flow of information Relationships (partnering, deals, give and take) used to solve issues Need more people (inefficient) No accountability Leadership Performance dictated by performance information Specification is only the intent Quality control by contractor Vendor has control Performance measurements Decrease flow of information High performance vendors used to minimize risk Need less people (efficient) Accountability Inefficiency vs Efficiency Can you make the transition?
Performance-Based Functions III. Negotiated II. Performance-Based High • Treat as a Commodity • Volume Based • No Accountability • Finger Pointing • Management & Inspection • Minimum Standards • Client minimizes risk • Value & Performance • Maximize Profit • Vendor Accountability • Minimized Management & Inspection • Quality Control • Vendor minimizes risk Performance IV. Unstable Market I. Price-Based Competition Low High
Best Value Overview • Complete business model for organizations & projects • A best value selection and management tool (developed and tested over 16 years) • It can be applied to any type of system, organization, structure, procurement, project, or need • Best Value is not just a procurement method. It is a selection and management tool that can be applied in: • Business Services (IT, dining, consultants, equipment, doc mgmt, insurance, etc.) • Facility Services (maintenance, roofing, janitorial, landscaping, supplies, etc.) • Design, bid, build (DBB), Design build (DB), Construction manager at risk (CMAR) • A/E & Design, Job Order Contracting (JOC), Indefinite Delivery Indefinite Quantity • BV is not a computer software package, but rather a combination of IMT principles that allows a client to make an informed decision
What does the Best Value Model do? • Makes things simple (measurement, dominant information) • Minimizes the fuel of bureaucracy (decision making, non-dominant information, management, control, and direction) • Creates transparency • Allows organizations/vendors to be highly efficient and successful • Proposes that to accurately identify what “is” and then to have a plan to efficiently meet the needs will minimize risk
Silo Buster – Make Things Simple 30K Foot Level Simplicity/Dominant Information Contracting Contractors / Manufacturers Planning / Programming Inspectors Designer/Engineering Users Technical Details