Download
1 / 84
860 likes | 1.09k Vues
Electricity in the World and India. India has the fifth largest generation capacity in the world. The top four countries, viz., US, Japan, China and Russia together consume about 49 per cent of the total power generated globally.

E N D
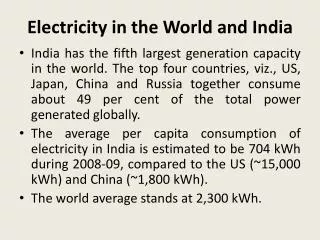
Electricity in the World and India • India has the fifth largest generation capacity in the world. The top four countries, viz., US, Japan, China and Russia together consume about 49 per cent of the total power generated globally. • The average per capita consumption of electricity in India is estimated to be 704 kWh during 2008-09, compared to the US (~15,000 kWh) and China (~1,800 kWh). • The world average stands at 2,300 kWh.
Indian Electric Power Survey • The Central Electrical Authority’s 17th Electric Power Survey was released in May, 2007. • The Electric Power Survey Committee conducts periodic surveys of electricity demand and holds discussions with all the stakeholders to bring out demand forecast for use in planning exercises of all key sectors of economy i.e. coal, rail, manufacturing, infrastructure, research, industries, etc.
Power for All by 2012 • The Ministry of Power has set a goal - Mission 2012: Power for All. • A comprehensive Blueprint for Power Sector development has been prepared encompassing an integrated strategy for the sector development with following objectives:-- Sufficient power to achieve GDP growth rate of 8% - Reliability of power - Quality power - Optimum power cost - Commercial viability of power industry - Power for all
RGGVY • The Rajiv Gandhi Grameen Vidyuthikaran Yojana (RGGVY), aimed at rural electrification, is an initiative to provide focus and funds to rural distribution. • As of 31st March 2011, a total of 587 projects were sanctioned, at a cost of Rs. 26,349 crores, electrifying 1,18,499 un/de-electrified villages.
Coal – The World • Coal currently fuels 40% of the world electricity and this proportion is set to remain static over the next 30 years. • About 70% of the world's steel production is based on coal.
Coal Reserves in India (as on 01.04.2009 - in billion tonnes)
Extractable Coal Reserves 1 • The coal that can be extracted—taking into account geological, technical, and economic aspects - is only a small fraction of our total coal inventories, without taking into account the “no-go” areas. • The extremely high figure of 267.21 billion tonnes has created a false and risky notion that India is quite comfortably placed with over 100 years of domestic coal supply at its disposal.
Criticism of Indian system of reporting (Indian Standard Procedure 1957) • Based on categories defined by concentration of exploratory boreholes. • Purely geological resource accounting system. • Does not consider mineability /extractability/ economic criteria. • Thus highly exaggerated resource inventory.
Coal Reserve Data Criticism • Gross, cumulative and does not consider depletion/ sterilization; includes coal • That was extracted during past 230 years of mining. • That was burnt / is burning in Jharia / Dhanbad and elsewhere. • That would be almost impossible to mine • In partially developed thick seams, in mine barriers, and in inundated mines. • Under reserve forests, tiger reserves, townships, rivers, major railways etc. • In seams between 600-1200 m depths and deeper.
Sector-wise Coal Production • The provisional total production of coal in 2008-09 was around 492.9 million tonnes which was higher by 7.8% as compared to the previous year. • Coal mining was confined mainly to the public sector contributing 92.4% in both the years i.e. 2007-08 and 2008-09. • In 2007-08, out of the total production of coal, 7.5% was coking coal and the rest 92.5% was non-coking coal.
Coal – Power Sector In India, about 77% of the total coal output is consumed in the power sector.
Coal – Indian States 1 • Chhattisgarh is the largest coal producing state with a share of about 20.7%, followed closely by Orissa and Jharkhand having contribution of 20.0% and 19.5%.
Coal – Indian States 2 • Next in order of share in the total production were, Madhya Pradesh (14.5%), Andhra Pradesh (9.0%), Maharashtra (7.9%), West Bengal (4.6%) and Uttar Pradesh (2.4%). • The remaining 1.40% of coal production accrued from the states of Assam, Jammu & Kashmir and Meghalaya.
Coal Mining Profile 1 • In 2008-09, share of production of raw coal from opencast (OC) mines was 88% against 12% from underground (UG) mines.
Coal Mining Profile 2 • Opencast mines damage a large land surface area, displace people from their ancestral homesteads and cause agricultural losses. • But the method is cost effective, recovery is high, comparatively better in safety aspects and is considered to be a modern method. • Surface mining requires large areas of land to be temporarily disturbed.
Coal Mining Profile 3 • As on 31.3.2009, there were 561 operating mines for coal in the country, out of which 197 were opencast while 332 were underground mines. The remaining 32 were mixed collieries. • There were 537 public sector mines and 24 mines in private sector.
Mining-Induced Displacement and Resettlement 1 • Mining-induced Displacement and Resettlement (MIDR) poses major risks to societal sustainability. • MIDR leads to landlessness, joblessness, homelessness, risk of marginalization, change in population dynamics, higher cost of living, more health risks, disruption of formal educational activities and increased addictions.
Mining-Induced Displacement and Resettlement 2 • MIDR is accompanied by the resettlement effect, defined as the loss of physical and non-physical assets, including homes, communities, productive land, income-earning assets and sources, subsistence, resources, cultural sites, social structures, networks and ties, cultural identity and mutual help mechanisms.
Mining-Induced Displacement and Resettlement 3 • Displacement—Key Social Issue. • Displacement of people due to coal mining is inevitable and is of enormous magnitude 1,70,000 families or 8,50,000 displacees to be rehabilitated by 2025. • Land requirement to double from current 1,47,000 ha to 2,92,500 hectares.
Mining-Induced Displacement and Resettlement 4 • Very limited data and socio-economic information on PAPs. • Fernandes: about 5 million (DPs and PAPs) for all mining (mostly coal) (disputed). • 75% of displaced people’s lives worsened due to displacement. • Detailed socio-economic data needs to be monitored, collected, and authenticated on a routine basis for all projects.
Mining-Induced Displacement and Resettlement 5 • Coal projects are being held up because of social protests against mining. • Little/no information on abandoned mines; reclamation and mine closure problems. • Rehabilitation and Resettlement (R&R) should make sure that people are better off than before. R&R should include creation of social assets and benefit sharing. • Need for coal companies to be progressive and pro-active in dealing with their past.
Mining-Induced Displacement and Resettlement 6 • PAPs need to be part of the decision making process.
Coal Mine Profile 1 • There were 559 coal mines (as on 31.03.2008) which reported production in 2007-08. Out of these, 174 mines were located in Jharkhand, West Bengal had 102 mines, Madhya Pradesh (74), Chhattisgarh (57), Maharashtra (53), Andhra Pradesh (52) and Orissa (27). • The remaining 20 mines were located in the states of Assam, Jammu & Kashmir and Uttar Pradesh.
Coal Mine Profile 2 • In 2007-08, there were 76 large mines each producing some 10 lakh tonnes of coal during the year and these mines accounted for 74.3% of the total production. • About 25.2 % of the total coal production was shared by 380 mines whose individual production varied between 50,000 to 10 lakh tonnes. • Only 0.5 % of the production was contributed by 103 small mines each producing up to 50,000 tonnes.
State PSUs in Coal Mining Bihar State Mineral Development Corporation Ltd (BSMDC), Damodar Valley Corporation (DVC) and Jammu & Kashmir Minerals Ltd. (JKML) are the State Government undertakings engaged in coal mining.
Lignite Mining • Of the thirteen working mines, all of them opencast, three are owned by Neyveli Lignite Corporation (NLC), five by Gujarat Mineral Development Corporation Ltd. (GMDCL) and three by Rajasthan State Mines and Minerals Limited (RSMML) and one mine each is with Gujarat Industries Power Co. Ltd (GIPCL) and Gujarat Heavy Chemicals Ltd (GHCL). • Sector-wise twelve mines are under public sector and the remaining one is under private sector i.e. GHCL.
Captive Coal Mining 1 IISCO steel plant of SAIL is the only public sector steel unit operating captive mines for coal. Bengal Emla Coal Mines Ltd (BECL), Jindal Steel & Power Ltd (JSPL), Hindalco and Tata Steel are the companies, operating captive mines in the private sector.
Captive Coal Mining 2 • At present, captive coal blocks are only allotted to companies in power, cement and steel sectors. • Till 31.3.2009, a total of 201 coal blocks with 47,340.2 million tonnes geological reserves have been allotted in various states.
Captive Lignite Mining • Similarly, 30 captive lignite blocks with 2,223.53 million tonnes geological reserves have been allocated in Gujarat (12 blocks), Rajasthan (17 blocks) and Tamil Nadu (one block) for power (17 blocks and commercial (13 blocks) till 31.3.2009.
Captive Coal and Lignite Mining • In consultation with CIL and NLC, 47 new coal blocks with geological reserves of about 17721.52 million tonnes and 38 lignite blocks with geological reserves of about 6240.34 million tonnes have been identified.
Characteristics of Indian Coal Deposits • LIMITED RESERVES OF COKING COAL • HIGH ASH AND LOW CALORIFIC VALUES ( 40% & ABOVE & AVERAGE 4000 K.CAL./KG-UHV) • MISMATCH IN LOCATION OF DEPOSITS AND MAJOR CONSUMPTION CENTRES • HIGH COST OF TRANSPORT • PIT HEAD PRICE – 43% • ROYALTY/CESS/SALES TAX – 13% • TRANSPORTATION – 44%
Beneficiation of Non-Coking Coal • Study by Planning Commission concluded that carrying beneficiated coal > 400 km is more attractive. • 70% thermal coal moves > 400 km but only 20% of coal is beneficiated at present.
Coking Coal Washeries • Presently 19 coal washeries (15 in public sector and 4 in private sector) with 33.28 million tonnes per annum capacity produced 7.18 million tonnes coking coal in 2008-09. • Production of washed coking coal during 2008-09 was 4.26 million tonnes in Public Sector and 2.93 million tonnes in Private Sector.
Non-Coking Coal Washeries • 31 coal washeries with 97.32 million tonnes capacity produced 40.95 million tonnes non-coking coal during the year. • In public sector, 7 non-coking coal washeries were operational, whereas in private sector, 24 non-coking coal washeries were in operation.
Indian Port Sector – Major Ports • Major ports are governed by Government of India. • 6 ports each on east coast and west coast. • Handle about 66% of total seaborne traffic. • All ports are ISPS compliant. • Capacity as on 31-03-2010 : 616.73 million tonnes. • Throughput during 2009-10 : 561.09 million tonnes.
Indian Port Sector – Non-Major Ports • Governed by the state governments. • No of Ports : 200 – Operational : 62. • 35 Ports are ISPS compliant. • Handle about 34% of total seaborne traffic. • About 75% of Non-Major Port traffic handled by Gujarat State alone.
Indian Port Sector – Non-Major Ports Cargo Mix : POL – 50% Iron Ore – 17% Coal – 14% Fertilizer & FRM – 2% Cement & Clinker – 5% Container – 5% Others – 6%
Coal handling in major ports –traffic growth (in million tonnes)
Plans for development of additional coal handling facilities 1 • Deepening and widening of entrance channel to facilitate larger size vessels at Paradip, Visakhapatnam, Chennai, Ennore, Tuticorin, New Mangalore. • PARADIP – Mechanized Coking Coal / Thermal Coal Handling facilities. • VISAKHAPATNAM – Mechanized cargo handling facilities at GCB at Outer Harbour for ship side handling @ 25000 TPD as well as mechanized loading into wagons at East yard dumps.
Plans for development of additional coal handling facilities 2 • ENNORE - Development of a Coal Terminal to handle coal for users other than TNEB. • TUTICORIN – Construction of a Coal Berth for NLC TNEB. • NEW MANGALORE – Development of coal handling facilities for captive users.