Download
1 / 30
311 likes | 694 Vues
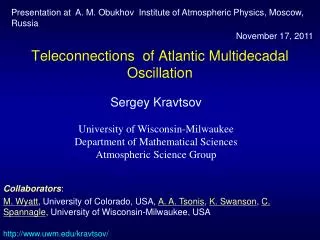
Presentation at A. M. Obukhov Institute of Atmospheric Physics, Moscow, Russia November 17, 2011. Teleconnections of Atlantic Multidecadal Oscillation. Sergey Kravtsov

E N D
Presentation at A. M. Obukhov Institute of Atmospheric Physics, Moscow, Russia November 17, 2011 Teleconnections of Atlantic Multidecadal Oscillation Sergey Kravtsov University of Wisconsin-Milwaukee Department of Mathematical Sciences Atmospheric Science Group Collaborators: M. Wyatt, University of Colorado, USA, A. A. Tsonis, K. Swanson, C. Spannagle, University of Wisconsin-Milwaukee, USA http://www.uwm.edu/kravtsov/
My background and research interests 1993 — MIPT, MS: Singular barotropic vortex on a beta-plane (G. M. Reznik, MS advisor) 1998 — FSU, PhD: Coupled 2-D THC/sea-ice models (W. K. Dewar, PhD advisor) • 1998–2005 — UCLA, PostDoc: Atmospheric regimes, wave–mean-flow interaction, coupled ocean–atmosphere modes (M. Ghil, post-doc advisor; A. Robertson, J. C. McWilliams, P. Berloff, D. Kondrashov)
2005–present — University of Wisconsin-Milwaukee (UWM), Dept. of Math. Sci., Atmospheric Science group: Multi-scale climate variability: atmospheric synoptic eddies/LFV (S. Feldstein, S. Lee, N. Schwartz, J. Peters), oceanic mesoscale turbulence/large-scale response (W. Dewar, A. Hogg, P. Berloff, I. Kamenkovich, J. Peters) Model reduction (D. Kondrashov, M. Ghil, A. Monahan, J. Culina) Regional climates and global teleconnections (C. Spannagle, A. Tsonis, K. Swanson, M. Wyatt, P. Roebber, J. Hanrahan) Weather/climate predictability, decadal prediction
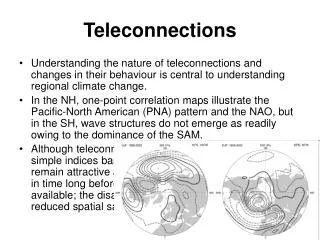
Topics to be considered: Atlantic Multidecadal Oscillation and Northern Hemisphere’s climate variability (with M. Wyatt and A. A. Tsonis) Empirical model of decadal ENSO variability
ATLANTIC MULTIDECADAL OSCILLATION AND NORTHERN HEMISPHERE’S CLIMATE VARIABILITY M. G. Wyatt, S. Kravtsov, and A. A. Tsonis (Published in Climate Dynamics, April 2011)
Leading EOF of the difference between CMIP-3 multimodel ensemble mean and observed surface temperature(2008, (Kravtsov and Spannagle) Has been identifiedin GCMs as an intrinsic mode • Dominated by anomalies in North Atlantic region Has a multi-decadaltimescale –0.5ºC +0.5ºC
Network of climate indices NHT — surface air temperature in the NH AMO — Atlantic Multi-decadal Oscillation AT (AC) — Atmospheric mass Transfer (or Atmospheric Circulation) Index NAO — North Atlantic Oscillation NPO — North Pacific Oscillation PDO — Pacific Decadal Oscillation ALPI — Aleutian Low Pressure Index
Preliminary analysis 13-yr running-mean filtered indices lagged correlations found between pairs of climate indices Statistical significance of lagged correlations and compatible pairs of indices: 3 yr 2 yr 3 yr 5 yr 5 yr = 3 yr + 2 yr: Compatible indices
M-SSA on our annual climate-index network M-SSA — analogous to EOF analysis, but uses, additionally, lagged covariance info • significance estimates based on uncorrelated red-noise fits to members of index network
Reconstructed Components: • Extended 15-index network • Each index is de- composed into multi- decadal signal (blue) and higher-frequency variability (red) • Relative variations of the two are to scale
Summary for Stadium Wave The NH climate indices exhibit a multi-decadal signal inconsistent with random alignment of uncorrelated red-noise time series This stadium-wave signal has the following phase relationships (lags in yr, uncertainties estimated using bootstrap re-sampling of index subsets): Modeling studies provide clues to the dynamics behind the stadium-wave links
Multidecadal Pacing of Interannual Deviations From the Stadium Wave Consider the anomalies with respect to the stadium-wave signal (red lines on an earlier Fig.) Compute (almost) the sum of squared cross- correlations for various subsets of indices over sliding window of 5–10 yr: connectivity measure Fit a multi-dimensional red-noise model that mimics the climatological lag-0, and lag-1 auto- and cross-correlations among the indices Identify index subsets and yearswith abnormal connectivity values exceeding those expected from the red-noise model
Identification of synchronizing index subsetsin 6-index subnets Yellow/orange cells indicate abnormal synchronizations within 6-index subsets 1976 1958 1940 1923 1917
Identification of synchronizing index subsetsin 6-index subnets 1976 1940 1917 “Successful” synchronizations were followed by a climate shift (Tsonis, Swanson, Kravtsov 2007)
Climate shifts are characterized by change of dominant climate pattern over the NH (e.g. the 1976 shift) and by different NAO & ENSO regime 1940 1976 Weak ENSO/ NAO Strong ENSO/ NAO Strong ENSO/ NAO
Discussion A multi-decadal climate signal is tentatively generated in the North Atlantic Ocean due to intrinsic variability of the MOC (THC) This signal “propagates” across the entire NH as a sequence of delayed teleconnections — stadium wave The stadium wave is associated with climate regime shifts which alter the character of interannual climate variability (ENSO and NAO) The dynamical processes behind regime shifts may themselves feed back onto and pace the stadium wave
AN EMPIRICAL MODEL OF DECADAL ENSO VARIABILITY S. Kravtsov (Submitted to Climate Dynamics)
Conjecture: Modulation of ENSO activity is due to “stadium wave” teleconnections Consider seasonal sea-surface temperature (SST) time series on a 5x5º grid (30ºS–60ºN) during 20th century • Despite multidecadal and interannual variability have different spatial patterns, which vary according to their respective predominant time scales, they maystill be dynamically linked! • Use spatiotemporalfilter to isolate multidecadal signal! Examples: EOFs (Preisendorfer 1988), M-SSA (Ghil et al. 2002), OPPs (DelSole 2001, 2006), DPs (Schneider and Held 2001), APT (DelSole and Tippett 2009a,b).
SST discriminants Patterns that maximize ratio of multidecadal to interannual SST variance (Schneider and Held 2001); SST data is based on Kaplan (1998). • Time series correlated with global Ts • This and next pattern ~AMO+PDO
Multidecadal variations in Niño-3 • Niño-3 SST is natu- rally dominated by interannual variability (DPs’ contribution is small) • Niño-3 variance exhibits multidecadal modulation anti- correlated with the AMO index(cf. Federov and Philander 2000; Dong and Sutton 2005; Dong et al. 2006; Timmermann et al. 2007)
Niño-3 modulation an artifact? Due to random sampling (Flügel et al. 2004) • CVs themselves are largely the long-term modulation of ENSO Analysis Procedure: • Generate surrogate SST time series using multivariate linear inverse modeling (LIM) Decompose surrogate SSTs into CVs and anomalies, regress Niño-3 STD onto three leading CVs, compute correlation between actual and compare with observed reconstructed Niño-3 STD, correlation
RESULTS Conclusion: Correlation btw large-scale predictors and ENSO is unlikely to be due to random factors
Let’s model this process statistically • Model Niño-3 index xas a 1-D stochastic process where fis a polynomial function ofx with coefficients that depend on time t(seasonal cycle) and external decadal variablesy given by leading Canonical Variates (CV) of SST; dw is a random deviate. • Study the numerical and algebraic structure of this model and use it to estimate potential predictability of decadal ENSO modulations
Algebraic structure of ENSO model F – potential function
Cross-validated hindcasts of ENSO STD: Jack-knifing with 15-yr segments omitted/predicted 2 or 3 external predictors (2 better!) Linearly extrapolated or fixed external predictors (fixed better!)
Summary We used statistical SST decomposition into multidecadal and interannual components to define low-frequency predictors(CVs). • An empirical Niño-3 model trained on the entire 20th-century SST data and forced by CVs captures a variety of observed ENSO characteristics, including multidecadal modulation of ENSO intensity. • The cross-validated hindcasts using linear extrapolation of external predictors are promising • These results argue that decadal ENSO modulations are potentially predictable, subject to our ability to forecast AMO-type climate modes.