Download
1 / 19
190 likes | 226 Vues
Analysis on CDHP effects on provider and patient payments, service utilization, illness burden compared to other health plans. Study limitations and interpretations provided.

E N D
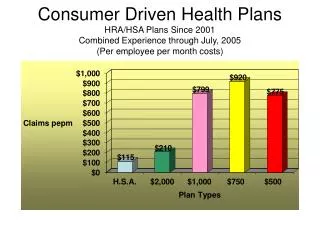
Consumer-Driven Health Plans:Early Evidence about Utilization, Spending and Cost Stephen T ParenteRoger Feldman Jon B Christianson October, 2003
Questions to be Addressed • What was the impact of CDHP on provider payment? • What was the impact on patient expense? • Was service use different for the CDHP? • Is illness burden different in CDHP and other health plans?
Analysis Goal and Challenges • Analysis goal: Compare cost and utilization over time by individual employee/patients in a CDHP (Definity Health) and other health plans • Technical challenge: Link employer and health plan data over time. • HIPAA challenge: Personal Health Identifiers (PHI) such as social security number or name are needed for identification. Needed to navigate through HIPAA obstacle course.
Study Setting • Health plan choices by employees: • HMO, 2000-2002 • PPO, 2000-2002 • CDHP, 2001-2002 • Variation in cost sharing by contract • Take-up of CDHP approximately 15%. • General caveat: Each of the six employers’ experience can be quite different due to: • Alternatives offered • Plan design • Communications with employees • Sponsor’s objectives for the plan
Presentation of Results • Results are limited to two groups of employees who worked for their firm continuously for three years (2000-2002) where: • Employee chose the CDHP in 2001 and 2002. • Employee chose another health plan in 2001 and 2002. • This limitation removed 40% to 50% of all employees from the analysis. • Why make this limitation? We want to see both adoption and maturing impact of CDHP while controlling for prior spending. • 2000: Pre-CDHP experience controls for prior spending • 2001: CDHP adoption year • 2002: CDHP ‘maturation’ year
What was the gross impact on provider and patient payment? NOTE: These are results from a restricted continuously enrolled sample of 50% to 60% of the total employee population and are not a reflection of the plans’ full PMPM expenditures. Also note: 1) Patient expenditures from the Personal Care Account (PCA) are included in the employer payment category. 2) Consumer payment reflects deductibles, copayments, and coinsurance expenses.
What was the impact on provider & patient payment by different services? NOTE: These are results from a restricted continuously enrolled sample of 50% to 60% of the total employee population and are not a reflection of the plans’ full PMPM expenditures.
What was the impact on provider and patient payment? • Average provider payments were higher for patients choosing CDHPs. • Biggest jump was for hospital costs. • Overall underlying inflationary trend. • Patient expenses are similar in both plans.
Was service use different for CDHPs?Physician visits *Utilization data presented are per member averages. NOTE: These are results from a restricted continuously enrolled sample of 50% to 60% of the total employee population and are not a reflection of the plans’ full physician visit experience.
Was service use different for CDHPs?Admissions and prescriptions *Utilization data presented are per member averages. NOTE: These are results from a restricted continuously enrolled sample of 50% to 60% of the total employee population and are not a reflection of the plans’ full admissions and prescription drug experience.
What was the CDHP impact on utilization? • Large increase in CDHP admissions that fits the preceding trend in increasing expenditure. • Generally consistent pharmacy trends for each population. • Underlying increase in the demand for services, particularly prescription drugs, over time, for all plans. • Physician office visit use is consistently less among the CDHP population.
Is illness burden different? *Data presented are per member averages. NOTE: These are results from a restricted continuously enrolled sample of 50% to 60% of the total employee population and are not a reflection of the plans’ full illness burden..
Is illness burden different? • The CDHP illness burden index started lower but ended higher. • Combined with earlier inpatient results, it suggests CDHP participants used more intensive therapies.
Interpretation • Why could the CDHP be more expensive? • More resource-intensive procedures and medical services for sicker patients may be required for treatment. • Reflected in higher admissions. • Reflected in higher costs of all physician services for a range of therapies from office visits and inpatient surgery. • Why are office visits and pharmacy services lower? • CDHP patient may be substituting with greater use of nurse ‘call lines’ as opposed to seeing a doctor. • Prescription drug use is lower, but our results suggest that it may be due simply to the initial favorable selection.
Summary • Early evidence provided mixed results on cost & use: • Pharmacy cost and use are lower for CDHP, but it appears to be mostly due to selection. • Office visits for CDHP are initially lower due to selection, and later lower due to the CDHP effect. • CDHP total costs were initially affected by favorable selection, but then rose compared to the other health plans. • Initial favorable selection, but illness burden grows over time. Illness burden changes could be due to the CDHP population getting sicker or to more intensive use of services which would drive the case-mix index higher. • Much needs to be explored to understand how health plan design in combination with FSA contribution and out of pocket premiums ultimately determine the social policy assessment of CDHPs.
Additional Work Needs to be Completed to Verify Results • CDHP admissions are higher than expected and need to be more extensively examined to make sure admissions are being accurately counted. Small sample size may be an issue here. • The total expenditure increase for CDHP needs to be further understood.
Next Steps • Examine other employers’ data for comparison. • Look for what happens when employee “savings” fill gap between PCA & deductible. • Examine employers willing to provide more than two years of data to see longer-term CDHP effects. • Explore other specifications of illness and health status (e.g., chronic illnesses).
CDHP, HMO versus PPO PMPM Differences for Continuously enrolled sample
Distribution of CDHP Population by PCA Usage Levels Continuously enrolled population