Download
1 / 47
480 likes | 502 Vues
This document discusses the various diagnostic techniques used to measure and analyze electron beams and radiation pulses in SPARC for VUV (visible to ultraviolet) operation.

E N D
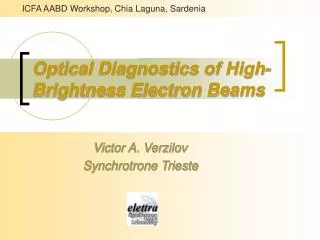
Diagnostics in SPARC • Electron Diagnostics • Optical Diagnostics • Requirements for VUV operation A.Doria, G.P. Gallerano, E. Giovenale, I. Spassovsky SPARC meeting – Frascati, 16 November 2005
SPARC activity a2.3 “FEL Realization in the Visible-VUV Spectral Range” Final goals programmed for the end of the third year of the project: • Ob. 2.5 (activity a2.3): Realization of a FEL SASE source in the visible. • Ob. 2.6 (activity a2.3): Operation extension of the FEL SASE source in the region around 100 nm by means of the coherent harmonic generation mechanism. Workshop SPARC – Frascati, 14 November 2005
CRITICAL ELEMENTS • Realisation of non destructive electron beam diagnostics • Ultra short radiation pulse measurements in the UV spectral range • “Single-Shot” temporal and spectral measurements
SHORT ELECTRON BEAM BUNCH MEASUREMENTS TECHNIQUES • Methods involving RF electric fields and static magnetic fields for the longitudinal phase space measurement (invasive) • Electro-optic Techniques (weakly invasive) • Coherent Radiation Emission from short electron bunches (weakly invasive)
3 2 1 1 x q e-beam z Non-distructive e-beam Diagnostics based on Smith-Purcell effects • The electron bunch generate an “Image Charge” oscillating over the grating surface. • “TM-like”mode excitation, having the electric field longitudinal component. • Radiation emission in the sub-mm range with the vaiation of the collecting radiation angle • Coherent spontaneous emission caused by the short bunch duration (15 ps) • Considerable power level (100 mw) helpful for electron beam diagnostics 1: Grating 2: Variable angle light collecting system 3: Light output
Extraction of the beam profile from the angular distribution of the radiation • Non destructive diagnostic it can be maintained in place during the beam alignment The radiation angular distribution depends on the electron beam longitudinal profile g=4.56 t = 14 ps G. Doucas et us. Phys Rev. Special Topics – Accelerators and Beams 5 072802 (2002)
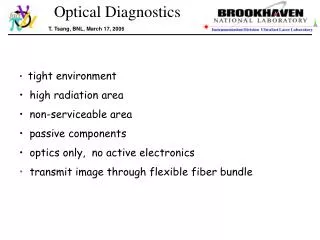
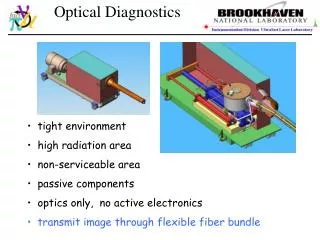
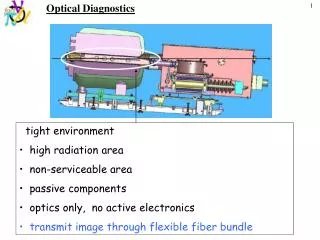
FEL SASE Optical Diagnostics • Electron beam alignment along the undulator sections (SASE/CTR) • SASE radiation signal evolution along the undulator: • Power • Transverse dimensions • Pulse length and spectrum • Spectral properties (possibly “time-resolved”) • Ultra-short pulse measurement
e-BEAM ALLIGNMENT BY MEANS OF CTR Coherent Transition Radiation (CTR) is generated by the Al foil in the forward direction Undulator Radiation stopped or reflected Undulator Al foil few mm thick Mirror at 45° Can reflect both the CTR and the Undulator Radiation
SASE Signal Evolution Along the Undulator (Courtesy of Luca Giannessi)
Back Thinned CCD Video Camera Hamamatsu C8000-20
SPECTRAL ANALYSIS SPEX monocromator equipped with a CCD on the focal plane
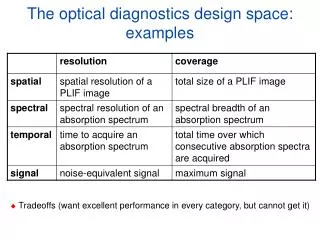
Requirements For VUV Operation Main characteristics of the required instrument wide spectral range of operation 40-550 nm (from EUV to visible) • high spectral resolution the spectral width of the FEL emission is expected l/Dl1000 the required resolution is l/Dl > 10000 over a single pixel (spectral line sampled by 10 pixels) • wavelength and intensity calibration all the components (optics and detector) have to be calibrated with wavelength in order to measure the beam intensity • complete remote operation all the operations on the different components have to be done by remote • compactness the instrument has to be moved at different points of the FEL amplification channel
THE INSTRUMENT The instrument is a NORMAL-INCIDENCE VACUUM SPECTROMETER Optical design The instrument consists of an entrance slit, a concave diffraction grating illuminated in normal incidence and a 2-dimensional detector A single optical element (namely the concave grating) provides the spectral dispersion and the focusing on the spectral plane Minimum number of reflections maximum efficiency
CHARACTERISTICS ENTRANCE SLIT Almost close position (20 mm) acquisition of the high-resolution spectrum spectral characterization an undefined number of photons is blocked on the entrance slit plane (if the image size is larger than the slit size) only relative intensity characterization Completely open (2 mm) all the photons are transmitted (if the image size is smaller than 2 mm) absolute intensity characterization (i.e. number of photons emitted) GRATINGS The instrument has 3 interchangeable gratings, optimized in different regions of the spectral interval to be acquired DETECTOR High-resolution EUV-enhanced CCD detector, with sensitivity from the near IR to the soft X-ray region
Ultra short Pulse Measurement • Temporal pulse profile of the SASE with and without “seeding” • In presence of “seeding” autocorrelation measurements are feasible • In absence of “seeding” “single-shot” measurements are necessary (Streak Camera) • Temporal resolution limits • Dynamical range requirements
Hamamatsu C5680 • Can operate in single-sweep and synchroscan mode • Various versions covering 115 nm to 1600 nm, and X-ray • Time resolution < 2 ps (typ.) Hamamatsu C7700 • Single-sweep streak camera • Extremely high dynamic range of up to 10,000:1 in a single shot. • Different tubes cover the spectral range from 200 to 1060 nm. Hamamatsu C6138 Fesca 200 • For single-sweep operation • Spectral range 280 to 850 nm, and X-ray • Time resolution < 200 fs (typ.)
Optical Rectification P»E0(w,t) E*0(w+W,t) E0(w,t) c(2) • Generation of THz radiation is possible in non-absorbing electro-optic material. This is a second order effect. • The rapid oscillations of the radiation electric field are “rectified” and only the envelope remains. The polarisation switching speed is very high and present virtually no limit. • The non linear polarisation generated moves in the medium with a lower phase velocity, due to the lattice vibration contribution. The result is an emission in a typical Cerenkov cone configuration.
P(w) [erg/sec] w [cm-1] THZ Radiation Generation as Rectification Process of the FEL SASE signal
General Diagnostic Lay-out U magnetic undulator section; C diagnostic vacuum chamber; W optical workbench 750 mm x 750 mm for the radiation analysis; At the end of the last undulator section an optical table (OB) 1200 mm x 2400 mm is placed, capable to collect not only the radiation from the last section U, but also any signal arriving from each W.
SPARC Hall section and optical transport line SPARC Hall “Sala Macchine Inferiore”
Undulator Vacuum Chamber Compatibility with tha gap value among the undulator magnets, Nominal gap 9.5 mm @l = 500 nm. External dimensions of the vacuum chamber set at 8.0 mm. A transverse dimension of 13 mm guarantees an adequate stiffness to the chamber P = 10-5 mbar in the middle of the section Rectangular section with blunted angles and thickness of 0.5 mm (LN Industries – CH) The pipe ha a length of 2500mm made of non-magnetic stainless steel AISI 316L by wire drawing with certified precision.
Vacuum System and Test • The main difficulty in designing the vacuum system for the SPARC project is related to the need to maintain the photocathode in a very clean environment, reaching high vacuum levels, while operating in the undulators and diagnostics zone with less strict requirements • Each section of the line is composed by a 2.2 meters long rectangular pipe, whose transverse dimensions are 1.2x0.8 cm2. Obviously such a pipe-work acts like a strong impedance for vacuum, and so it’s necessary to perform carefully calculations in order to set up a good vacuum design. • Some of the components have been tested: a system composed by a section of the undulator pipe (1.2 meters long, 1.2x0.8 cm2 section) has been evacuated by means of a 68 l/sec turbo-molecular pump (Varian V70LP), a dry scroll pump capable of 82 l/min (Varian SH-100). The system was also connected to a 50 l/s Ion pump (Varian VACION plus 55). Asymptotic values were measured at level near the pumps on one side, and the level on the other side of the pipe, to evaluate the impedance.
Vacuum Simulations • In order to perform easily vacuum calculations a software has been aquired, that allows to perform vacuum simulations on complex systems. • The software is VACSIM MULTI, by SOFTSIM (UK), and makes use of the electronic circuit simulator SPICE libraries making use of the one to one correspondence between vacuum and electronic circuits parameters. • To test the software we have compared the results of the simple system we tested to the simulations obtained through Vacsim. The first step was the definition of the parameters of the vacuum components present in the system. Once the components have been correctly parameterized, including pumps, volumes, impedances, out-gassing and leaks, we built a design for the vacuum system.
near pumping system other edge of the pipe Time (h) Vacuum Test Results • Simulation results are reported. The asymptotic value of the vacuum is close at both ends to the experimental one (about 10-5 mbar), but in the test this value was reached in a longer time. • Vacuum difference between the two edges is about a factor 50. • Simulations result to be closer to the experiment if the out gassing rate of the components is set to a higher value. • We then “baked” the pipe to clean it up and then repeated the test. After baking, the simulation is much closer to the experimental one. • Finally we checked if the system can be retained at the required vacuum level by the ion pump only. Simulations have been performed, together with experimental tests, and both gave positive results. • The shutdown time of the turbo molecular pump can be easily identified in the graph.
Diagnostic Workbench Quadrupole Undulator Undulator Diagnostic Chamber Spectrometer CCD Camera
CCD for the e-beam fluorescence and radiation analysis “Wake Fields” suppression pipe Chamber L=20cm E-beam target Q L=6cm Strip-Line Specchi per La radiazione Flange of 5 cm for pumping module connection Three step movement Diagnostic Chamber I
Diagnostic Chamber II The project of the diagnostic chamber is mainly based on the definition of the available free space between two consecutive undulator sections. The technical drawings indicate how the chambers could be realised under the present hypothesis. Inside the chamber are present two different vertical actuation systems, with three steps, capable to host different optical systems. The vertical movement will be realised by means of motorised linear stages, with no rotational actuation. The reason is that the position of the optics must be determined with a precision and repeatability of the order of 10-20 mm. Such necessity is related to the fact that electron beam misalignments higher than these values may alter, the SASE process, preventing to obtain saturation
Diagnostic Chamber III The problems that are still open, and that prevent us to definitively launch the project are two: the first is related to the final projects for the focusing quadrupole and for the Phase-Shifter.
Radiation propagation of fundamentals and harmonics through gas and solids I The material that present a better transparency in the EUV spectral region is the Lithium Fluoride (LiF) for which a transmittance has been measured down to 120 nm. The refractive index behaviour, vs. l, is important both for evaluation of the reflection coefficient and of the Brewster angle Downstream the window the radiation will be transported in the free space before arriving to the experimental area The water vapour in the air is responsible for the absorption in the visible and in the infrared, but allows a transmittance higher than 40% at wavelengths shorter than 600 nm.
Radiation propagation of fundamentals and harmonics through gas and solids II At much higher frequencies the EUV photons interact with electronic levels of the atoms, i.e. in the case of the air, mainly with the nitrogen. Air transmission, as a function of pressure, at a wavelength of 100 nm. The conclusions are that if we want to analyse the fifth harmonic of the SPARC source we must realise a radiation transport channel under vacuum, with pressure values not higher than 10-2 torr.
Pumping system with rough pump: 10-2 torr Pumping system with rough pump + turbo + ion pump : 10-7 torr Undulator Undulator Pumping system with rough pump + turbo + ion pump : 10-7 torr Diagnotic Chamber SOLUTION I Pumping system with rough pump + turbo + ion pump : 10-7 torr Undulator Undulator Diagnostic Chamber with a LiF window SOLUTION II Radiation propagation of fundamentals and harmonics through gas and solids III There are two possible solutions: the first consists in having a single value of pressure inside the vacuum transport pipes of the order of 10-6–10-7 torr. The second solution requires a differential vacuum between the undulator chamber and the radiation transport pipe. The separation between the two different pressure values can be done with a LiF window that, is the material with a wider spectral transmission range. The thickness, for 1 inch diameter and a differential pressure of 10-7 torr, can be of few microns!!
Seeding Activity within SPARC Project • In the SPARC experiment the electron beam is 10 ps long and has a flat-top profile • The seed radiation is very short, about 100 fs • A jitter of +/- 1 ps is tolerable in SPARC, but in future, will be compressed down to 1 ps time range, thus the jitter requirements will get tighter
160 nm – 20 kW 160 nm – 5 MW Synchronization Importance A perfect synchronization is realized when a maximum power for the radiation generated at the undulator exit is recorded. Undulator length for the power measure must be chosen in order to maximize the differences between the SASE process and the seeding process. (Courtesy of Luca Giannessi)
ENEA Amplifying chain The seeding experiment requires a synchronisation of to the electron beam with the radiation seed generated by pumping a gas jet with a femtosecond high energy Ti:Sa pulse within the SPARC project. This synchronisation is realised by means of a properly designed delay line between the two replica of the Ti:Sa pulses from a MIRA 900 oscillator each of them following two different amplifying chains: one pumping the photo-cathode while the second pumping the gas jet. MIRA 900 Delay Line (max 7 ns) Amplifier Amplifier Gas Jet Photo-Cathode
Streak Camera Jitter Measurements I Our task is the measuring capability of this ideal synchronisation together with a time jitter between the electrons and the seed. To this purpose a Streak Camera will be used capturing the signal of the spontaneous emission (strictly related to the electrons) and the signal of the seed. Seed Electrons -> Spontaneous Emission
Jitter Measurements II • The Streak Camera owned by ENEA has been refurbished using the EUROFEL funds. The streak tube is the original one and it has only been tested by Hamamatsu indicating resolutions very close to 1 ps. • The new imaging unit is a CCD camera with optics down to 400 nm and a new software for the analysis of the images dispersed in time. • The camera has an intrinsic time jitter of few tens of ps, but in single shot acquisition we can perform the a study of the relative jitter between spontaneous emission and seed. The new software has the capability to perform this analysis. • Before to run this measurement on SPARC we can test the technique using a MIRA 900 Ti:Sa laser present in ENEA for the THz project. Tapping the mirror we can introduce a jitter Streak Camera MIRA 900
Beam Pointing Stability Measurements I The MIRA 900 Ti:Sa that will be used to test the jitter measurement technique has been used to verify the beam pointing stability of this oscillator after 10 metres of trajectory.
To the retro-reflector And back Beam Pointing Stability Measurements II The radiation is collimated and analysed by a quadrant sensor from Hamamatsu with micron resolution. From preliminary test the stability is in the order of 10 microns, but any movement around the test area can increase this number
Hamamatsu C6138 FESCA 200 Streak image, taken with the FESCA-200, used to measure Cerenkov radiation. A LINAC was used to generate an electronic pulse, which, in contact with the air, produced Cerenkov radiation. Photo courtesy of Dr. Mitsuru Uesaka, Associate Professor, Nuclear Engineering Research Laboratory, Faculty of Engineering, University of Tokyo.
SPARC time–dependent GENESIS simulations; l = 485.5 nm; lu = 3.3 cm; Lsat = 11.0 m; @ 89 A = 0.5·10–6 m rad = 10–4
quadrupoles photo injector solenoid Diagnostics Diagnostics dipoles 5.0 m RF sections 1.5 m 20º 6.0 m 1-6 Ondulator modules 1.5m 10.0 m 14.5 m 6.6 m Evoluzione del segnale SASE lungo l‘ondulatore • Deflessione del fascio di elettroni(una stazione di misura al termine dell’ondulatore) • Deflessione ottica(una stazione di misura in prossimità di ciascuna sezione di ondulatore) • Utilizzo di “foil” sottili metallizzati “free standing” per il rinvio della radiazione nel visibile e UV “foil” a basso numero atomico Z non vengono danneggiati dal fascio di elettroni Coherent Transition Radiation (CTR) dal film può essere utilizzata come diagnostica combinata sul fascio di elettroni
SPARC time–independent GENESIS simulations • = 485.5 nm; Lsat = 11.0 m • U = 3.3 cm E = 150 MeV I = 150 A = 2·10–6 m rad = 10–3
Extension of the technique to pulses shorter than 1 ps The three curves referto an exponential-shaped pulse (0.5 ps long) and to twotriangular shapes of 0.5 and 0.45 ps, respectively; Eachpulse is assumed to contain 85% of the particles. e-beam5 mm above the grating surface e-beam size 0.1 x 0.2 mm. g = 2000 lG = 0.1 mm