Graph Representation and Visualization Techniques Overview
Explore the challenges and solutions in representing and visualizing data at scale, including human inference levels, cognitive interpretation, and non-photorealistic rendering techniques. Learn about the art of visualization and drawing systems. Discover the intersection of technology and cognition in data visualization.

Graph Representation and Visualization Techniques Overview
E N D
Presentation Transcript
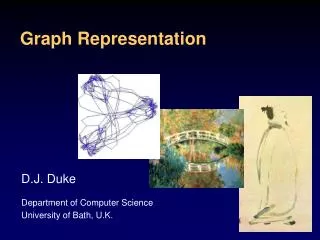
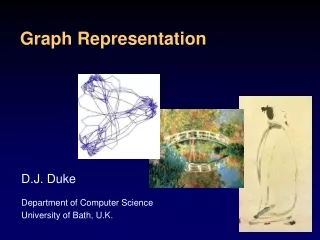
Graph Representation D.J. Duke Department of Computer Science University of Bath, U.K.
Overview • The challenge of scale • Knowledge and cognition • kinds of knowledge • human information processing • Art and Rendering • drawing and denotation systems • NPR • Enhancing visualization • Some of the open issues …
Visualization • Motivations: • presentation: “See this!” • confirmation: “Can we see this?” • exploration: “What can we see?” • Shift work from logical to perceptual • Utilise latent knowledge
/d VTK tools talks vtkbin Rendering Local Debug bin Wrap vtkAdjList.cxx vtkAdjList.h vtkAdjListTcl.obj vtkAdjListTcl.cxx Vtk.exe vtkAdjList.obj Example /d VTK /d talks /d tools VTK Local VTK Rendering VTK vtkbin vtkbin bin vtkbin Debug vtkbin Wrap Local vtkAdjList.h Local vtkAdjList.cxx bin vtk.exe Debug vtkAdjList.obj Debug vtkAdjListTcl.obj Wrap vtkAdjListTcl.cxx
The challenge of scale • Technology pushing level of ambition: • size of datasets • complexity of relationships within the data • complexity of the underlying domain • Some of the solutions: • streaming, parallelism, cluster hardware • level of detail control • Is the user becoming the bottleneck?
Approaches to scale • Scientific visualization – McCormick et al. • Information visualization – Card et al.
Human inference • Levels of inference (Gahegan / MacEachren) • abduction: classification from experience • induction: classification from attributes • deduction: classification from rules • Sources of meaning • public • private • How and where does a representation work?
Cognitive interpretation • Interacting Cognitive Subsystems • Barnard, 1979 - • generic processing unit • cognition distributed across 9 systems • principles of information processing • Use of ICS (Barnard, May, Scott et al.) • clinical psychology; emotion • CTA (Cognitive Task Analysis) • display decomposition
AC MPL ART PROP BS node p540 +-[parent]- p539 +-[children] – [many] IMPLIC node p741? parent = “down” … OBJ VIS LIM Levels of interpretation
Blending at input array Copied into episodic memory ... Incoming representations Transformed into output representations Subsystem operation … and revived
Memory and learning implic Novel representations require intervention of “central engine” PIP-loop prop Over time subsystem image record forms generalised records, e.g. CTRs Eventually, knowledge becomes proceduralized
Uloomo Takete Implicational channels • Much visualization uses structural channel • Implicational “emotive” interpretation is also available …
Non-Photorealistic Rendering (NPR) Schumann, Strothotte, Raab & Laser: Assessing the affect of non-photorealistic rendered images in CAD. In Proc. CHI’96, ACM Press
Representation: geometric structure attribute mappings Design issues: perceptual cues knowledge assumptions kinds of inference General problem in visualization “‘Good’ visualizations mix metaphors” [Hanrahan] The “art” of visualization
C.elegans cell lineage, Sulston From “To Draw a Tree”, P. Hanrahan, 2001
Machine-part assembly From “To Draw a Tree”, P. Hanrahan, 2001
Drawing on art What can we learn from artistic techniques? Interest in • European school of realism vs • Japanese/Chinese traditions
View of Delft Vermeer
Boating on the river below a Buddhist temple Wu Li
Artistic Traditions • Japanese / Chinese painting • relationship to philosophy? • European school of realism • studies of perspective (Dürer) • studies of physiology (da Vinci) • Photography • 20th century: impressionists, cubists …
Les Tuileries Pissarro
Le Jardin Monet
Katata Hiroshige
Drawing Systems • From “The Draughtsman’s Contract” by J. Willats • Spatial relationship between objects • Different kinds of fidelity: • faithful to appearance • faithful to shape • Visualization • how is space used? • what concept(s) does space capture?
Denotation system • Relation between marks and real world. • Painting: • Marks represent pattern of light intensities • Visual system interprets as shapes • Drawing • What do lines stand for? • Visualization • What does an edge in a graph represent?
Example (1/2) • Multiple signs: • Nodes • Edges • Elided regions Latour tool (www.cwi.nl/InfoVisu)
Example (2/2) • combine multiple • sources (context + data) • techniques (stream-surface + scalar) • levels of detail • levels of certainty VTK LOxSurface2 example (www.kitware.com/vtk)
Systems issues • Scientific visualization: • generic representations: streamlines, iso-surfaces, … • generic algorithms: marching cubes, … • modular toolkits: AVS, Iris Explorer, VTK, … • Information visualization: • generic representations: trees, cushion maps, … • generic algorithms: Reingold-Tilford, … • tools?
Modularity • Simple dataset model helps sci.vis.: • generic algorithms • composable representations • Aim to achieve similar in info.vis.: • combine distinct representations • support novel info.vis. algorithms • build on infrastructure, e.g. streaming
A Unified View • Data = geometry + topology + attributes • Geometry = points in the space • Topology = organization of points into cells • Implementation: implicit or explicit
Abstract points and cells • Points = data items • Cells = relationships between data a c k n Points = a … e l p j e Cells = j ... p o m b d
BRS-AMS £110 AMS-ZUR AMS-ZUR £140 £60 LHR-ZUR LHR-ZUR £176 £176 0800 1100 1200 1300 0900 1000 Cells as records • BOZ (Casner, 1991) • Query database of flight information • Design display of results relative to task LHR-AMS £105
from = LHR to = ZUR dept = 0800 arr = 0930 price = £176 avail = yes from = LHR to = AMS dept = 0945 arr = 1055 price = £105 avail = no from = LHR to = ZUR dept = 1130 arr = 1300 price = £176 avail = yes from = AMS to = ZUR dept = 0900 arr = 1030 price = £60 avail = yes from = AMS to = ZUR dept = 1100 arr = 1230 price = £140 avail = yes from = BRS to = AMS dept = 0830 arr = 0955 price = £110 avail = yes BOZ (cont.)
VTK • Visualization Toolkit • C++ class library (~ 600 classes) • Wrappers for Tcl, Python, Java • Open source: public.kitware.com/vtk/ • Separation of data and process objects • Datasets – separate slide • Process objects: source, filter, mapper
datafile vtkPolyDataReader vtkPolyDataNormals vtkMapper vtkGlyph3D vtkMapper vtkSphereSource VTK in action • Process execution demand-driven • Only execute if output needs updating ?
vtkTopology vtkGraph vtkGeometry vtkDataObject vtkDataObject vtkGraph VTK Data Sets vtkObject vtkDataSet vtkRectilinearGrid vtkPointSet vtkImageData vtkPolyData vtkPolyData vtkStructuredGrid vtkUnstructuredGrid
vtkConeTree vtkStrahlerMetric vtkGraphGeometryFilter vtkCubeSource vtkTransform vtkFieldDataToAttributeDataFilter vtkTransformPolyDataFilter vtkLookupTable vtkTubeFilter vtkGlyph3D vtkPolyDataMapper vtkPolyDataMapper vtkActor vtkActor vtkRenderer Tree pipeline Source file vtkProgrammableSource
From trees to graphs • Module for general graph layout: • spanning DAG • tree layout • graph • Management of edge bends: • add pseudo-nodes, ignore for node drawing • apply layout positions to “real nodes” • better: use polyline mechanism? graph DAG layout GenGraphLayout3D graph
Initial results • Web site • cone-tree layout • Strahler metric • splatting • FSM simulation • 3D graph layout • generalized Strahler
Further work • Extensions to basic tools • interaction techniques, e.g. brushing • multiple representations • minimal rendering of overview • attribute management • Significant support already present • level-of-detail control • pluggable interactors • multiple viewports
Summary The brain is not subject to Moore’s law. • Visualization is not a panacea … • users’ mental representations • combine discrete / “continuous” models • Knowledge representation • public / private levels [MacEachren] • integration with other representations • Flexible tools are a first step.
Thanks … • David Auber LABRI, Uni. Bordeaux, France • Phil Barnard MRC Cognition & Brain Science Unit, UK • David Duce Comp. Sci, Oxford Brookes University, UK • Ivan Herman W3C, Amsterdam, The Netherlands • Scott Marshall Glaucus Proteomics B.V., The Netherlands • Jon May Psychology, University of Sheffield, UK • UK Engineering and Physical Sciences Research Council