Great
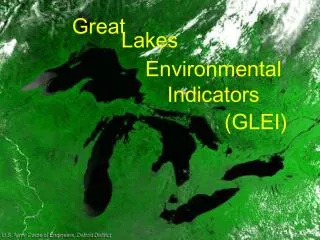
Great. Lakes. Environmental Indicators. (GLEI). http://glei.nrri.umn.edu/default/Reports.htm. Objectives. Quantify stressor-response relationships for novel and existing indicators; Develop predictive models to infer ecological status; Develop integrative metrics among sub-components.

Great
E N D
Presentation Transcript
Great Lakes Environmental Indicators (GLEI)
Objectives • Quantify stressor-response relationships for novel and existing indicators; • Develop predictive models to infer ecological status; • Develop integrative metrics among sub-components
SOLEC Indicator Classes • SOLEC differentiates between indicator types: • Pressure (= stressor) indicators (e.g. contaminants) • State (= response) indicators (e.g. fish populations)
Multimetric & Multivariate Approach DEGRADED REFERENCE LANDSCAPE segment-sheds & watersheds STATE INDICATORS Geology Elevation Hydrography Climate Land Use/Cover Shoreline Units High energy shore Embayment Coastal marsh River-influenced wetland Protected wetland PRESSURE INDICATORS Habitat patch Hydrology Food web Substrate Nutrient dynamics -Habitat -Chemical -Biotic -Physical -Hydrologic Diatoms Vegetation Macrobenthos Fish Amphibians Birds Water Quality Contaminants LOCAL -Habitat quality, -Habitat quantity INTEGRATED INDICATORS
Spatial & Temporal Scales 100yr Contaminants, diatoms (cores) T e m birds p 10yr o r a l fish vegetation S year amphibians c a month invertebrates l e WQ days meters 10km Spatial Scale
Stratified Random Sample open shoreline Protected wetland (Barrier beach) riverine influenced wetland low energy (embayment) High energy 2 types of shoreline 3 types of wetlands
Site Selection vs Site Characterization • Need to move quickly into the field. • No complete inventory of geomorphic types or anthropogenic stressors. • Data for site selection can be coarse, but across the Great Lakes Basin. • Site characterization data should be high resolution, but only needed for sampled sites.
Site Selecton - • Segment Sheds as Summary units • Watersheds for lengths of shoreline beginning and ending ½ way between 2nd order and higher streams (n = 762). • Data summarized across US side of Great Lakes 2nd order Segments
Lake Ontario 90 Lake Erie 102 Lake Huron 148 Lake St. Clair 12 Lake Michigan 157 Lake Superior 236 Connecting Channels 17 TOTAL 762
Stressor Gradient (cont.) DATA SOURCE Agriculture fertilizer and herbicide use (NRCS) Ag Runoff (erosion, pesticides, and nitrogen; NRCS) Distance to nearest AOC (Areas Of Concern; EPA) National Atmospheric Deposition Program (NADP) Population density (US Census Bureau) Land use by cropland type (NRCS) Erosion from agricultural land (NRCS) Fertilizer use on agricultural land (NRCS) Confined animal facility waste treatment (NRCS)
Stressor Gradient (cont.) DATA SOURCE Shoreline alteration (MRV; ACOE) Land use, general (USGS-NLCD) N, P runoff potential (USGS-NAWQA SPARROW) NPDES categories (EPA) Urbanization amount/rate (NRCS) Wetland amount (total; NRCS) Wetland types, hydric soils, and erosion (NRCS-NRI) Road area, 4 types (US CENSUS TIGER) Soil properties (NRCS STATSGO) Toxic Release Inventory points (EPA from BASINS)
Classify Stressors Purpose: to reduce overlap in the types of information from different stressor source Seven ‘natural’ categories • Agricultural / Ag-chemical (n = 21) • Atmospheric Deposition (n = 11) • Human Population / Development (n = 14) • Landcover (n = 23) • Point-source / Pollution (n = 79) • Shoreline (n = 6) • Soils (n = 53)
Define Segment-sheds Cluster Analysis Select Segment-sheds Second-round PCAs Compile Stressor Data Evaluate & Categorize Stressors Data organization PCAs of Individual Stressor Cat. Ordering sites in stressor-space (multivariate statistics) 1 2 3 4 5 6 7 Site selection Select Sampling Locations within Segment-sheds
Site Selecton (cont.) • Anthropogenic Stressor Gradient • Summarized 217 variables from 19 different sources to identify a multi-deminsional stressor gradient (Represented using PC’s of 7 natural categories)
Site Characterization • Identified specific watershed for sampled sites • GPS from the field • Locale polygons created for each sub-component team. • Complex polygons for each sampled area • Watersheds delineated for complexes • Stressors summarized. GPS points from field Complex polygons from locale polygons Locale Polygons from GPS Watersheds for Complexes
Scalable Watersheds – Arc Hydro • ArcHydro data model – developed to “pre-process” elevation data to more efficiently delineate watersheds. • AGREE drainage enforcement using NHD line- work • Fill sinks, flow direction, flow accumulation, stream identification, sub-catchment delineation.
Catchments Streams ArcHydro – Cont. • Catchments are delineated for each stream confluence and river mouth along coast. • Catchments for river systems are dissolved together. Catchment
ArcHydro – Cont. • Along the coast, areas between river mouths, but outside of watersheds remain. We refer to these mostly small coastal watersheds draining directly to the coast but without significant streams as “Coastal Interfluves”.
Coastal Interfluves Extending Watersheds to the Coast
ArcHydro – Cont. • Both stream and interfluve sheds are then ordered and numbered along the coast from west to east. • This provides a framework for scaling stressor summaries up and down the coast.
Additional Efforts • Lake Erie Integrated Habitat Map • Both US and Canadian sides of Lake Erie basin. • Canadian Great Lakes Anthropogenic Stressor Gradient. • Currently summarizing stressors in the same way as we have done for GLEI for Canadian side of Great Lakes Basin • Full ArcHydro implementation for Saint Louis River (Lake Superior), Maumee and Grand River watersheds (Lake Erie). • Provides for “accumulated stress” or landscape characterization down the drainage network.
Accumulated SumRel stressor score for the Saint Louis River Watershed