Research Team:
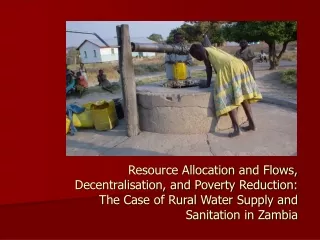
Resource Allocation and Flows, Decentralisation, and Poverty Reduction: The Case of Rural Water Supply and Sanitation in Zambia. Research Team:. Eric Gutierrez WaterAid, Regional Advocacy and Research Adviser for Southern Africa

Research Team:
E N D
Presentation Transcript
Resource Allocation and Flows, Decentralisation, and Poverty Reduction: The Case of Rural Water Supply and Sanitation in Zambia
Research Team: Eric Gutierrez WaterAid, Regional Advocacy and Research Adviser for Southern Africa Webby Wake University Zambia, Acting Chair, Department of Economics Savior Mwumbwa WaterAid, Research Officer
Outline of Presentation • Brief on the Annual Budget Process • Findings of the study • Estimating finances needed to meet MDGs
Transitional National Development Programme 2002-2005 (Multi-stakeholder consultations) Poverty Reduction Strategy Paper 2002-2004 (Multi-stakeholder consultations) Medium-Term Expenditure Framework 2003-2005, (Ministry/ Sectoral Advisory Groups) Public Investment Programme 2002-2005 (Ministry of Finance) Annual Budgets (Parliament) Tools for shaping and structuring the Annual Budget
The Resource Envelope Source: PRSP, May 2002
Finance Ministry calls for budget submissions April Budgets made by all spending bodies Head offices consolidate budget submissions and sends them to Finance Ministry May June-July THE BUDGET PROCESS OF ZAMBIA (IN THEORY) Parliament approves the budget for the following year; Appropriation Act Parliament deliberates on the budget; conducts budget hearings “Estimates” produced and sent to Parliament for approval August December Sept - November
Finance Ministry calls for budget submissions Budgets made by all spending bodies Head offices consolidate budget submissions and sends them to Finance Ministry April Aug-Sept December THE BUDGET PROCESS OF ZAMBIA (IN PRACTICE) Parliament approves Appropriation Act With no legislative authorisation for a budget when the financial year starts, President issues a warrant authorising release of funds from Treasury. March “Estimates” produced and sent to Parliament for approval Parliament deliberates the budget as ‘committee of the whole’ Jan - March January
1. Allocations in the Budget are Greater than the Resource Envelope Source: PRSP, May 2002 and Estimates of Expenditures, 2002 and 2003.
2. Great variance between provision and actual expenditure Source: Consolidated from 1999, 2000 and 2001 Financial Reports and 2002, 2003 Estimates of Expenditures. See Annex 1 for breakdown.
Table 7 – Comparison of Authorised Provision and Actual Spending on WSS Capital Expenditures, Ministry of Energy and Water Development, 1999-2001 Source: Consolidated from 1999, 2000 and 2001 Financial Reports and 2002, 2003 Estimates of Expenditures.
3. Local authorities have little say in the allocation and decision-making on resources • Local officials get to know about allocations only if central offices inform them • Local government personnel and machinery lie idle for most of the year because no funds are released (even when they are approved) • District governments do not have the power to budget for capital expenditures, only salaries and other recurring expenditures.
4. The budget process appears to be unsystematic and unclear • Are the tools for the annual budget (PRSP, TNDP, PIP) actually being used as tools? • Lack of clarity between the functions of the MEWD and the MLGH. • MFNP identified as spending body for WSS capital expenditures; not clear from budget whether this ended up in MEWD • Some bodies bid for more money than they can spend, because it will be cut anyway. • At the end of the year, unspent sums are transferred to other accounts • Parliament does not engage critically in the budget process.
5. WSS financial resources could easily be redirected away from unserved into better-served areas. • Urban centres getting the lion’s share of allocations for projects that were not identified as priorities for expenditure under the PRSP. • Not clear if poor peri-urban areas are prioritised under these allocations.
6. Donors provide 70-80% of allocations to WSS sector, and are driving much of the process. • On-budget donor support up to 70% of total spending; including off-budget, it could reach 80% • With this leverage, why have donors not pushed for decentralisation reforms in WSS? • Certain donor-supported sectoral reforms are evident, e.g. privatisation of urban water utilities.
Table 10: Identified On-budget Donor-Supported Items in the 2001 Zambia National Government Budget Allocations for Water and Sanitation Source: pages 147 to 155 Estimates of Revenue and Expenditure, 2002. Source for column on actual expenditure are pages 168-175 of Financial Report, 2001.
7. The approach to WSS provision is largely an engineering solution. 8. Sanitation is not on the agenda
Calculate what is needed to bring WPD in each district to 4 water points per thousand Table 5: Projections on the needed growth in number of rural water points in Kaoma District, Western Province, Zambia
Make national projections • Total number of water points needed each year – 1813 • Very rough calculation of cost – K 45 billion ($9 million) each year; reductions can be made if inventory is updated, and lower-cost technology options chosen. • This figure looks high but is not unaffordable. This is also high-value investment because of the impact of water provision on economic productivity, health and primary education. • Note: Equity in distribution is not shown here • Cost of updating inventory -- $1000 per district, at most 1 month work in each district, involving 8-10 local district and D-WASHE personnel; includes local district-level planning workshop
Some Recommendations • Undertake local level planning that is consolidated at district level • Decentralise financial allocation and decision-making through conditional grants from national to district governments (e.g. Uganda experience) • Strengthen budgeting mechanisms; non-state actors can lobby for the institutionalisation of budget reforms.