Download

1 / 43
430 likes | 448 Vues
This article explores recent advancements in spectroscopy, including phase retrieval and maximum-entropy procedures, to retrieve phase information and overcome challenges in determining geometrical structure from spectral data.

E N D
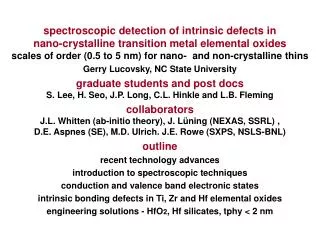
Some Recent Advances in Spectroscopy beyond Conventional Spectral Intensity Measurement Jung Y. Huang 黃中垚 (http://www.jyhuang.idv.tw) Department of Photonics, Chiao Tung University March 23, 2008
Forward Problem in Solid-State Physics: Specifying the spatial coordinates of all atomic species involved, and then calculating the energy levels and wavefunctions (via DFT): Atomic configuration Electronic structure The relation between the band structure and the real-space atomic configuration is non-intuitive, which makes the inverse problem quite difficult.
A profound question in physics: Does a complete set of spectral data contains enough information to determine the geometrical structure?--- or Can we hear the shape of a drum? Spectral and wave function properties can be reflected through optical susceptibility measurement. We are therefore interested in retrieving the phase information from the measured optical power spectrum in order to recover the complete optical susceptibility.
Maximum-entropy phase-retrieval procedure for sum-frequency vibrational spectroscopy Time-resolved two-dimensional infrared absorption correlation spectroscopy of ferroelectric liquid crystal (FLC) without and with a doping of zinc oxide nanoparticles Active spectroscopy to guide the evolution of a complex system and deduce the dynamic mechanism from the optimal laser field used Outline
Probing the molecular alignment on surface with Sum-Frequency Vibrational Spectroscopy (SFVS) SFVS: On a medium with an inversion symmetry: Resonance can be employed to make SFVS sensitive to molecular species.
Phase determination of optical susceptibility 1. Interferometry 2. Direct determination from optical spectrum.
Phase determination of SFVS susceptibility with interferometry
Phase determination of SFVS susceptibility with interferometry
Phase determination of nonlinear optical susceptibility from a NLO spectrum • Direct phase determination from incomplete information with maximum entropy principle • No need for data extrapolation (such as with Kramer-Kronig relations • Maximize the spectral entropy under the constraint of N measured spectral points S(f) Therefore, the MEM phase retrieval problem is simplified to find the error phase f(n)
A priori knowledge for MEM phase retrieval To estimate the error phase, we propose: Criterion A: For a spectrum with an isolated peak and negligible background, the imaginary part of the NLO susceptibility has a peak position the same as that of the power spectrum S(f). Criterion B: The real or the imaginary part of NLO susceptibility should asymptotically approach to a constant in region far away from resonance. Criterion C: For an isolated peak, the imaginary part of the NLO susceptibility is an even function relative to the resonant frequency. Here the resonant frequency is determined from the peak position of the power spectrum.
MEM for a multiple-peak IVSFG spectrum IVSFG of Silica/OTS/CCl4 interface
MEM for NLO spectrum with complex background: IVSFG of H/C(111) Different H coverages on Diamond C(111) surface
NLO spectrum with complex background • Top view along [111] • Hydrogen coverage with isolated dangling bonds = monolayer
Outline Maximum-entropy phase-retrieval procedure for sum-frequency vibrational spectroscopy Time-resolved two-dimensional infrared correlation spectroscopy of ferroelectric liquid crystal (FLC) without and with a doping of zinc oxide nanoparticles Active spectroscopy to guide the evolution of a complex system and deduce the dynamic mechanism from the optimal laser field used
Motivation for the 2D IR study of SSFLC • No single-species FLC can meet all application requirements, which is true even for FLC mixture. Doping FLC with nanomaterials can provide extra degree of freedom for tailoring material properties. • The application of SSFLC is often hindered by the mechanical problem. The doping-induced binding effect may increase the stability of the layer structure without sacrificing the fast response characteristic of FLC.
Sample Preparation • nc-ZnO (2Ro~3.2 nm): synthesized with wet chemistry behave like a molecular dopant • Capping agent (l~0.6 nm): 3-(Trimethoxysilyl) propyl methacrylate (TPM) • Doping Method:nc-ZnO nano powder was mixed into FLC to 1 wt%. • FLC: Felix 17/100
Two-dimensional Vibrational Spectroscopy Ultrashort laser had been used to probe the internal workings of molecular systems. A major development in this area is a technique known as two-dimensional vibrational spectroscopy,which can reveal • static structureof peptides and proteins ; • fast processes such as protein folding and peptide conformational dynamics; • the relationship between individual bondswithin or among molecular species.
2D IR Correlation Spectroscopy • 2D IR emulates techniques used in NMR. • However, molecular vibrational relaxation rates (in picoseconds) are orders of magnitude faster than typical nuclei spin relaxation rates (in sec). Therefore sub picosecond IR pulses shall be used in 2D IR to monitor molecular structural evolution. • We used a much slower process (with electric field and polarization angle of the incident IR) to perturb the molecular system of interest. • To generate 2D IR correlation plots, IR spectra were collected sequentially as a function of the perturbing parameter.
2D Infrared Correlation Spectroscopy By spreading peaks along the second dimension, one can often sort out complex or overlapped spectral features that cannot be detected along the first dimension. Synchronous Asynchronous
Summary of the Synchronous and Asynchronous 2D IR Correlation Plot Synchro. Plot:Information about the similarity in IR azimuthal pattern. Asynchro. Plot:Information about the dissimilarity in IR azimuthal pattern.
FLC FLC nc-ZnO: FLC nc-ZnO: FLC Synchro. IR Correlation Reveals Uniaxial Alignment
Asynchro. IR Correlation Reveals Angular Deviation nc-ZnO doped FLC FLC
Field-induced reorientation of SSFLC • Surface interactions unwind the spontaneous helix, which then yields a uniform FLC alignment with • sec Response • Bistability • Wide Viewing Angle
Time-resolved FTIR Spectroscopy Tracking correlated motion of sub molecular fragments in an electro-optical switching FLC mixture Time-resolved azimuthal patterns of IR absorption peaks at 1608 cm-1 (black) and2924 (red) cm-1
Time-resolved 2D IR Correlation Spectroscopy Tracking correlated motion of sub molecular fragments in an electro-optical switching FLC • Core groups: Peaks of the synchronous plot are sensitive to both U and 0. Pure SSFLC nc-ZnO:SSFLC
Time-resolved 2D IR Correlation Spectroscopy Tracking correlated motion of sub molecular fragments in an electro-optical switching FLC • Functional groups on alkyl-chain: Peaks of the synchronous plot are sensitive to both U and 0. Pure SSFLC nc-ZnO:SSFLC
Time-resolved 2D IR Correlation Spectroscopy Tracking correlated motion of sub molecular fragments in an electro-optical switching FLC • Core groups: Cross-peaks of the asynchronous plot are sensitive to 0 only. Pure SSFLC nc-ZnO:SSFLC
Time-resolved 2D IR Correlation Spectroscopy Tracking correlated motion of sub molecular fragments in an electro-optical switching FLC • Functional groups on alkyl-chain: Cross-peaks of the asynchronous plot are sensitive to 0 only. Pure SSFLC nc-ZnO:SSFLC
2D IR Correlation Phase Angle • Those stretching modes associated with the alkyl chains have larger angular spread than the core groups. • Doping SSFLC with nc-ZnO results in more concerted orientational switching at the sub molecular level.
By using an extrapolation length of dc=100 nm An aligning effect comparable to that with a strong anchoring surface! Possible Origin of the Improved Ordering
Outline Maximum-entropy phase-retrieval procedure for sum-frequency vibrational spectroscopy Time-resolved two-dimensional infrared absorption correlation spectroscopy of ferroelectric liquid crystal (FLC) without and with a doping of zinc oxide nanoparticles Active spectroscopy to guide the evolution of a complex system and deduce the dynamic mechanism from the optimal laser field used
Control of a Material System with Ultrashort Light • Go beyond the simple pump-probe spectroscopy by using the laser pulses to influence the course of the molecular dynamics. • This kind of work is usually carried out in a feedback loop with some form of pulse shaping element controlled by a computer. • An issue with coherent control is the inverse problem, i.e. how to retrieve information about the system dynamicsfrom the knownoptimal pulse. • The core techniques needed include: (1) characterization of ultrafast pulses; and (2) producing the pulses appropriate to the experiments.
Complete-field characterization of coherent optical pulses Spectral-phase sensitivity defined as the difference of the maximum and minimum of the signal varying as the phase retardation of the specific spectral phase components changes from 0 to 2π.
Complete-field characterization of coherent optical pulses • The freezing-phase algorithm can directly and rapidly yield complete-field information with only three scans over the pulse spectral range.
Complete-field characterization of coherent optical pulses • The freezing-phase algorithm can directly and rapidly yield complete-field information. • Both the magnitude and spectral phase profiles of a coherent optical pulse can be determined.
R Pulse spectrum Complete-field characterization of coherent optical pulses: freezing phase scheme PLE of the DUT Device under Test
Complete-field characterization of coherent optical pulses: freezing phase scheme d-QW: double Ga0.47In0.53As quantum wells embedded in a /4-thick Al0.48In0.52As layer; QD-/4: self-assembled InAs quantum-dots embedded in a /4-thick GaAs layer; QD-/2: self-assembled InAs quantum-dots embedded in a /2-thick GaAs layer
Coherent-controlled nonlinear optical microscopy Coherent control contrast enhancement as large as a factor of three can be achieved at regions where the PL peak wavelengths differ only 18 nm. spectrometer Input pulses Beam splitter Objective lens XY scanning stage sample SLM Grating Grating
Theory PL SHG Exp. THG Coherent and incoherent multiphoton processes in SBR
Coherent-controlled nonlinear optical microscopy Coherent control offers an additional degree of freedom to distinguish coherent and incoherent nonlinear optical processes. Spectral-phase sensitivity curves of two-photon fluorescence (TPF) and the corresponding phase profiles with the maximum TPF signal from the position P and S. The corresponding TPF spectra from the position-P, and S are presented.
optimized anti-optimized Important Question: What is the characteristic frequency among these binding nano objects? Characterize Material System via Quantum Control Future Development: Quantum-control technique for probing molecular recognition mechanism of Biomolecules.
Conclusions A MEM phase retrieval procedure had been successfully developed to yield complex susceptibility from the measured SFG power spectrum. Time-resolved 2D IR correlation spectroscopy had been used to reveal intra- and intermolecular motions in an electro-optical switching FLC. Control molecular response by laser pulses beyond simple pump-probe scheme is possible via coherent control technique.