Positive Trends in HISD: Decrease in Dropout Rates and Increase in Graduation Rates
Across the district, HISD has seen a decrease in dropout rates and an increase in graduation rates. Enrollment has increased by 2%, with 4,000 more students from the Class of 2009 to the Class of 2011. The number of students reading at grade level has increased, as well as students excelling in TAKS tests. There has been a notable rise in advanced placement tests taken and passed, narrowing the achievement gap. Additionally, more students are participating in SAT exams, taking dual credit courses, and receiving scholarships. HISD schools have earned state and national recognition, outperforming other major Texas cities in competitive grants.

Positive Trends in HISD: Decrease in Dropout Rates and Increase in Graduation Rates
E N D
Presentation Transcript
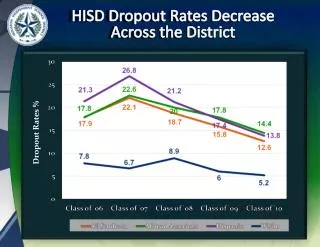
HISD Dropout Rates Decrease Across the District Dropout Rates %
HISD Graduation Rates Increase Across the District Graduation Rates %
Enrollment Districtwide Increases 2 Percent with 4,000 More Students Class of 2009 to Class of 2011 +2% Number of Students Enrolled +3% -4% +1% American
HISD Doubles Number of Breakfasts Served to Students 2009 – 2011 Total Number Breakfasts Served
Number of 3rd Graders Reading on Grade Level Increases to 65 Percent 9,745 3rd Graders At or Above the 50th NPR % Students Reading on Grade Level 61
More Students Districtwide Reading at Commended Level on TAKS 13 Percent Increase from 2009–2011 Number of Students Commended Reading +13%
More Hispanic Students Reading at Commended Level onTAKS 19 Percent Increase from 2009–2011 Number of Students Commended Reading +19 % +2 % +4 %
More Students Districtwideat Commended Level on TAKS Mathematics 9 Percent Increase from 2009–2011 Number of Students Commended Math +9% 8
More Hispanic Students at Commended Level on TAKS Mathematics 14 Percent Increase from 2009–2011 E Number of Students Commended Math +14% +1% -3%
More Students Districtwide at Commended Level on Science TAKS 35 Percent Increase from 2009–2011 Number of Students Commended Science +35%
More African American and Hispanic Students at Commended Level on TAKS Science 29 and 46 Percent Gain from 2009–2011 Number of Students Commended Science +46% +46% +14% +29%
More Students Districtwideat Commended Level on Social Studies TAKS 27 Percent Increase from 2009–2011 Number of Students Commended Social Studies +27%
More African American and Hispanic Students at Commended Level on Social Studies TAKS 20 and 39 Percent Gain from 2009–2011 Number of Students Commended Social Studies +39% +20% +2%
More Students Districtwide at Commended Level on TAKS Writing 6 Percent Increase from 2009–2011 Number of Students Commended Writing +6%
All Student Groups Make Gains at Commended Level TAKS Writing 2009 – 2011 Number of Students Commended Writing +7% +0.4% +4%
Number of Advanced Placement Tests Taken Increases 98 Percent Class of 2009 to Class of 2011 Advanced Placement Tests Taken +98% * Number of AP Exams Ordered
African American and Hispanic Students Take More Advanced Placement Tests Class of 2009 to Class of 2010 Number of AP Tests Taken +57% +11% +68%
Number of Advanced Placement Tests with Passing Scores Up 27 Percent Class of 2009 to Class of 2010 Number of AP Tests with Score of 3 or Higher +27%
Significantly More African American and Hispanic Students Pass Advanced Placement Tests Class of 2009 to Class of 2010 +47% Number of AP Tests with Score of 3 or Higher +48%
Achievement Gap Narrows 7 Points TAKS All Tests Taken 2009–2011 White/African American White/Hispanic Percentage Point Gap TAKS Passing Rate 38 35 33 32 27 26 25 25 19 18
SAT Participation Increases 7 Percent Class of 2009 to Class of 2010 Number of Seniors Taking SAT +7%
More African American and Hispanic Students Take SAT Class of 2009 to Class of 2010 Number of Seniors Taking SAT +13% +9% -9%
SAT Participation and Performance African American and Hispanic Students Make Gains as Participation Increases
Number of Dual Credit Courses Completed Districtwide Increases Number of Dual Credit Courses Completed +20%
Number of Dual Credit Courses Completed Increases for All Students +34% Number of Dual Credit Courses Completed +6% +6%
Scholarships Offered to HISD Students Increases 70 Percent Class of 2009 to Class of 2011 Total Scholarship Amount Offered +70%
HISD Schools Earn State and National Recognition Number of Schools *More Schools than Dallas, Austin, San Antonio, and El Paso Combined
Competitive Private and Government Grants to HISD More Than Doubles Competitive Grants in Millions