Download
1 / 29
290 likes | 473 Vues
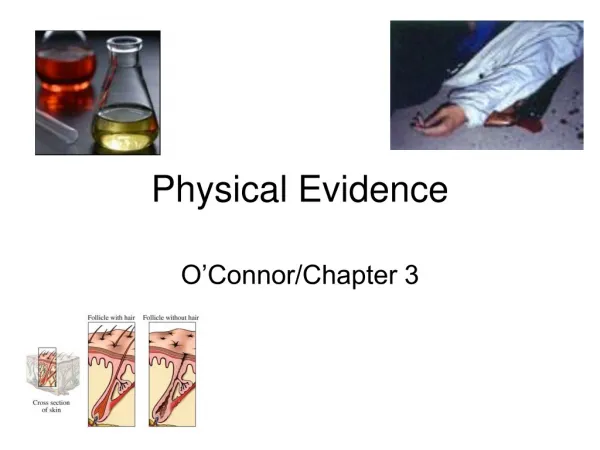
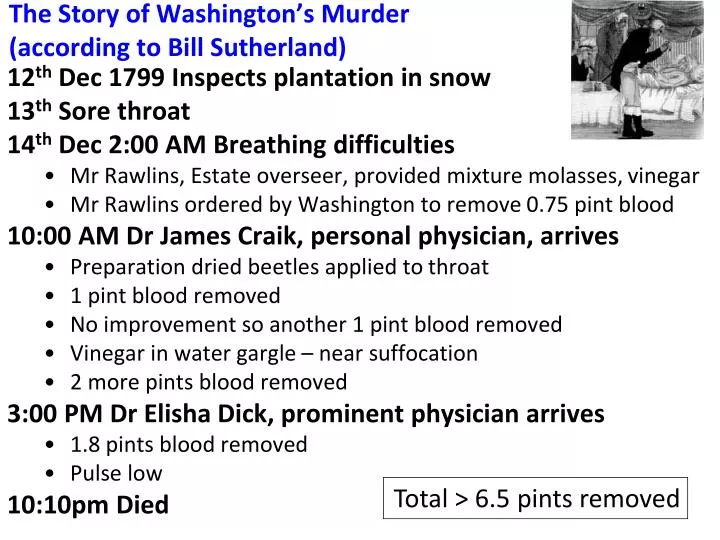
The Story of Washington’s Murder (according to Bill Sutherland). 12 th Dec 1799 Inspects plantation in snow 13 th Sore throat 14 th Dec 2:00 AM Breathing difficulties Mr Rawlins, Estate overseer, provided mixture molasses, vinegar

E N D
The Story of Washington’s Murder(according to Bill Sutherland) 12th Dec 1799 Inspects plantation in snow 13thSore throat 14th Dec 2:00 AM Breathing difficulties • Mr Rawlins, Estate overseer, provided mixture molasses, vinegar • Mr Rawlins ordered by Washington to remove 0.75 pint blood 10:00 AM Dr James Craik, personal physician, arrives • Preparation dried beetles applied to throat • 1 pint blood removed • No improvement so another 1 pint blood removed • Vinegar in water gargle – near suffocation • 2 more pints blood removed 3:00 PM Dr Elisha Dick, prominent physician arrives • 1.8 pints blood removed • Pulse low 10:10pm Died Total > 6.5 pints removed
Pierre Charles Alexandre Louis(1787-1872) • Introduced numerical methods to examine the effectiveness of medical interventions • Showed blood letting ineffective
Documented How Practitioners Make DecisionsMyth Anecdote Observation Comparison Replicated RRC Now Academic Practitioners Academic Future Practitioners Source: Sutherland 2007
Measuring EffectivenessAn Overture Measuring Conservation Effectiveness SummitMay 5-6, Palo Alto, California
Effectiveness QuestionAre Our Actions Leading to Desired Results? ?
Why We Are Focused on Effectiveness ?? The Focus for This Summit
Q2. What is the Unit for Measuring Effectiveness? Conservation Target Wildlife and Habitat Impacts Threats Direct Time to see an impact Level of confidence Indirect Outcomes Actions Outputs Costs of measuring change
Need to Integrate Measuring Effectivenessinto an Iterative Project Cycle
Biodiversity ConservationProjects Come In All Shapes and Sizes 1. A community fishing ground in the Pacific • A TNC preserve or provincial park • Coordinated efforts to manage state and federal funding for Puget Sound or Lake Ontario 4. The WWF Markets Initiative 5. A funder’s grantmaking strategy for the California Coastal waters, or the Coral Triangle
Similar Concepts, Different Terms An Excerpt from the CMP’sRosetta Stone Analysis
Conservation Measures Partnership’s Open Standards Are One Flavor of SPM • Developed by leading orgs & agencies • Draws on many fields • Open source & common language • Used around the world
Q4. How Much Should We Invest inMeasuring Effectiveness? SPM does not specify M&E Design !!
The “Burden of Proof” Depends on Risks,Costs, and Timeframe for Decision Making Generally Invest More in Measures When: • Stakes are high (high cost of error or inaction) • Potential to leverage learning • Costs of measures are low relative to actions Marisla Foundation Packard Foundation
Q5. Should We Mandate Measuring Effectiveness?The Bell Curve: Treating Cystic Fibrosis Distribution of Cystic FibrosisTreatment Center Success Rates A Surprise – The Best Get Better It’s the centers in the top quartile that are improving fastest….they are at risk of breaking away. What the best may have, above all, is a capacity to learn and adapt – and to do so faster than everyone else. The Bell Curve Leads to Uncomfortable Questions Will being in the bottom half be used against doctors in lawsuits? Will we be expected to tell our patients how we score? Will our patients leave us? Will those at the bottom be paid less than those at the top? The answer to all these questions is likely yes. AboveAvg BelowAvg Best Poor
Ultimately We Are Not Competing Within Conservation, But Against Other Social Causes • Worthy Cause A • Conservation • Worthy Cause B
Q7. How Do We Roll Out Measuring Effectiveness Both Internally…. After a guy gave an ‘air ball’ Six Sigma presentation…the standard joke was that the guy “decided to leave” before his elevator reached the ground floor.
Q7. How Do We Roll Out Measuring Effectiveness Both Internally….and Externally?
Measuring Effectiveness Can Transformthe Practice of Conservation • Practitioners in field using measures results to plan and implement effective projects • Managers and donors getting better information to improve work • All stakeholders learning from each other • Increased public support for conservation • Ultimately, better conservation outcomes