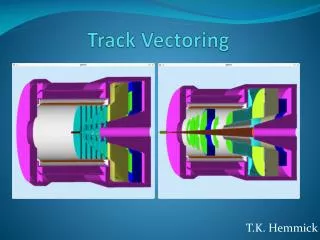
Track Vectoring
Track Vectoring. T.K. Hemmick. Background in SoLID Trackers. Signal Projective. Bkg non-Projective. Studies by Richard Holmes. PVDIS w/no baffles…. Signal MIP. BKG Large Signal. How to measure both?. E-deposit measurements plagued by Landau Tail. Measure more samples on the track.

Track Vectoring
E N D
Presentation Transcript
Track Vectoring T.K. Hemmick
Background in SoLID Trackers Signal Projective Bkg non-Projective • Studies by Richard Holmes. • PVDIS w/no baffles… Signal MIP BKG Large Signal
How to measure both? • E-deposit measurements plagued by Landau Tail. • Measure more samples on the track. • Use a “truncated mean” to refine dE/dx. • ALSO does e/pi separation at low momentum. • Thick collection gap = track vector. Mesh Primary Charge Fluctuation 17mm Drift Gap GEM 1 Transfer 1 1.5mm GEM 2 Transfer 2 1.5mm GEM 3 2mm Induction X-Y Strips Pitch: 400um Preamp/Shaper
Ghost ofTracks Yet to Come Downside: Data Size signal Extra data • A detector “layer” comes from the pre-amp shaping time. • Simple model: Detector is like layers • “Synchronous” Background: Data up, occupancy same. • “Asynchronous” Background: Data up, Occ up • Possibly untenable due to high background rates. • Requires quantitative analysis Orig. data Signal: --Starts on time --Ends on time --Single channel Ghost ofTracks Past
Mini-Drift GEM Det. + SRS Readout Y X • Std. 10x10cm CERN 3-GEM Det. • ArCO2 (70/30) • Gain ~ 6500 • ~17mm Drift Gap • Drift Time ~600ns • SRS /512 channels APV 25 • 30 x 25ns Time Samples • Martin Purschke’s newly • developed RCDAQ • affords high flexibility • COMPASS style Readout: • 256 x 256 X-Y Strips • ~10cm x 400um pitch Mesh Primary Charge Fluctuation 17mm Drift Gap GEM 1 Transfer 1 1.5mm GEM 2 Transfer 2 1.5mm GEM 3 2mm Induction X-Y Strips Pitch: 400um Preamp/Shaper
Brass Source Holder Preliminary Bench-Top Measurements ~50mm • GEM trigger doesn’t provide precise timing, so rely on ability to measure the first pad fired as a measure of t_zero • Det. requirements: high gain, low noise, low diffusion gas • Use timing from ADC to reconstruct z-coord. of track Sr-90 Reconstructing Low Energy Sr90 b- Tracks Reconstructed Vectors 1.00mm hole Tungsten Collimator X-Axis GEM TRIGGER 1nF Y-Axis Y-Vector Reconstructing Cosmic Ray Tracks Reconstructed Vectors Top Scintillation Counter GEM Detector Y-axis Bottom Scintillation Counter Y-Axis (mm)
Measuring Tracks at CERN Beam Test Test Beam Set Up at ENH1-H6 SPS Beam Jura 178 L1 410 TOP VIEW X Freiburg frame 1250 (π+,+120GeV/c) s640 veto Sci irradiated T1 T3 T5 T7 XY 205 26 26 26 2 XY 41 XY 726 Beam profile wire chamber x s1 5 s256 s1 Si1 Si3 z -θ Si6 15 Y-inverted y finger Sci (SA) s128 170 5 s256 s1 SC Z1 SB T2 T4 T6 T8 SB R17B Tmm6 3-GEM Mini-Drift on Rotating Table SD Saclay Saleve 10-12 Layer Micromegas Telescope Si Tracking System Tmm5 R17A XY XY Tmm2 XY XY Si Tracker X X X X X X X X 120GeV/c p+ MM Telescope Mini-Drift GEM Tmm3
Beam Test Results (40 deg. Tracks) Reconstructed Track from 1 Event • The charge arrival time for each strip is determined by the time profile of the raw signal. The z-coord. is then reconstructed by taking the product of the arrival time and the drift velocity of the detector gas. • The x_coord. is taken as the center of each strip. • The vector is determined from a linear fit to the reconstructed (x, y) pairs for the event. Raw Strip Signal ~Strip Charge 25ns Time Sample Strip Reconstructed Track Segment Tot. Charge at each fired Strip Strip Charge Arrival Time
Data Processing Raw Data: Waveforms in Time Vector Signature: “Charge square” Vector Recon. Z-residual < 0.5mm • Linear Fit to determine arrival time = x-int. • 30 samples x 25ns = 750ns window • Vector Recon: • X -coord. = middle of pad • Y-coord. = drift time * Drift Vel. • Fit (x,z) points to line Propagated Errors: Angle: ~+/-18mrad Charge arrival time: ~+/-1.8ns
Angular Resolution A first look at the Angular Resolution MC Simulation of Angle and Position Resolution • As a first attempt to determine the angular and position resolution, we do so without the aid of a reference track, determined by the high precision reference detectors within the beam test set up. • The angular resolution is determined here by simply taking the spread in the distribution of the reconstructed vector angle. This is known to be a reasonable approximation since the beam divergence is minimal. Track Recon. Fails (Rely on Charge Centroid) Uncertain Boundary Track Recon. Successful T. Cao, Stony Brook Preliminary Results Preliminary Results
Summary • Great idea for synchronous background rejection. • Ghosts of bunches past: • Stubs appear to “end early”. • Ghosts of bunches future: • Stubs appear to “begin late”. • Quantitative question: • Does it hurt, does it help?