Download
1 / 32
320 likes | 521 Vues
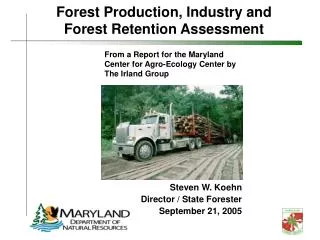
Forest Production, Industry and Forest Retention Assessment. From a Report for the Maryland Center for Agro-Ecology Center by The Irland Group. Steven W. Koehn Director / State Forester September 21, 2005. Background.

E N D
Forest Production, Industry and Forest Retention Assessment From a Report for the Maryland Center for Agro-Ecology Center by The Irland Group Steven W. Koehn Director / State Forester September 21, 2005
Background • In 2002, the Maryland Center for Agro-Ecology commissioned a study to assess forest production, industry and forest retention • The Question: What is the critical mass of forest land needed to support the wood-based manufacturing industry in Maryland?
Why the Question? • Changes in forest ownership and management • New forms of conservation valuation • Uncertain fiber supply • Sprawl • Business Challenges • Assorted public policy initiatives
To Answer the Question • Assess Maryland’s wood dependence • Estimate wood flows • Assess trends in Maryland wood-using industries • Explain impact of land use change • Identify significant issues and competitiveness challenges
Maryland’s Forests • Approximately 2.4 Million Acres of Forestland • 43% Forested • Over 130,600 Forest Landowners • Average Woodlot is 17 Acres Growth/Drain Softwood 1.25 Hardwood 1.31
Maryland Land Use Trends • Since 1950, 12% forest land loss -- 4% since 1982 • From 1982 to 1997, “developed” acres in Maryland increased by 35% - projected to increase by 14,000 acres per year • 7% Decrease in “rural” acres • 4% Loss in forest acres since 1982 • Ownerships are getting smaller, parcels more fragmented • Nationally, at least 25 million acres has dropped out of forest industry ownership since the 1980s • In 2003 alone, 4.5 million acres of major US timber holdings changed hands
Factors Affecting Industry Expansion and Fiber Availability • Challenging economic situation • Globalization of forest production and markets • Industry consolidations • Imports • Loss of secondary manufacturing • Weak markets for lower quality hardwoods
Global & U.S. Wood Use • Ind. wood use rose 40% since 1960: ~ 1.6 BM3 but flat over last 20 • Fuel wood use > industrial wood use: ~ 1.8 BM3 and growing • Ind. wood use could increase < 33% by 2050: from 1.6 - 2.1 BM3 • 75% of global wood and fiber will come from planted forests by mid century or earlier (Sedjo and others) • 31% of global solid wood consumption crosses an international boundary from tree to product; most likely to increase • US imports 30% of solid wood products consumed; exports associated jobs & impacts (81% growth since 1991) • US uses 30% of world’s solid wood products; largest per capita • US forest and wood choices drive global wood market UN FAO 2005: 2002 data + Perez-Garcia on future demand
US in Global Context Percent of World Share UN FAO 2005: 2000, 2003 data
Some Global Leaders Percent of World Share UN FAO 2005: 2000, 2002data
Global Plantation Forests Percent of World Share UN FAO 2005: 2000, 2002data
U.S. Imports from China Wood Household Furniture 41% and growing!
Furniture Imports China’s Share $ Billion
Softwood Lumber Competition from Southern Hemisphere Plantation Pine Timber Harvest From Southern Hemisphere Imports (Million BF) from Chile Brazil, Mexico, NZ, Australia Million M3 Source: R. Taylor, WMM Source: R. Taylor, WMM
Ways of Looking at Maryland’s Wood Dependence As Consumers of Forest Products, Marylanders: • Consume 5 million cords of wood per year • Rely on 2.2 million acres in-state, and 7.4 million acres outside the state to build homes, use paper, etc. • Are 20% self-sufficient
Ways of Looking at Maryland’s Wood Dependence As Producers of Timber and Forest Products: • About 35% of Maryland’s fiber is transferred out-of-state for processing • At the same time, Maryland’s industry relies on out-of-state fiber for 52% of its needs • Net Import Dependence is 38%
Maryland Wood Fiber Flow -- 2001 Wood Fiber Harvested in Maryland and Processed In and Out of State (All units in Green Tons) Industrial Roundwood Harvest Softwood 657,548 Hardwood 1,595,087 Exports 120,619 Pulp 566,989 Sawnwood 1,537,371 Other 27,645 Pulp Industry Roundwood 323,000 Rdwood Chips 244,000 Residues 244,300 TOTAL 811,300 Lumber 691,817 Residues 244,300 Fuel1 129,254 Mulch1 518,459 Farm1 137,705 Recovered Wood Fiber Const. Demolition Debris 32,858 Land Clearing Debris 15,430 Total 48,287 1 Includes Bark 5/28/2014 5:31:25 AM
Wood Fiber Processing in Maryland -- 2001 Wood Fiber From All Sources (In and Out-of-State) Processed in Maryland (All units in Green Tons) Softwood Total Rdwd Prod 670,603 Fuelwood1 13,055 Industrial Rdwd 657,548 Hardwood Total Rdwd Prod 1,790,647 Fuelwood1 195,560 Industrial Rdwd 1,595,087 Out of State 215,448 Out of State 451,276 Exports 4,418 Exports 116,201 Sawnwood 396,375 Pulp 241,150 Other 15,605 Other 12,040 Pulp 325,859 Sawnwood 1,140,996 Lumber 178,369 Lumber 513,448 Pulp Industry SoftwoodHardwood Roundwood 97,150 225,850 Rdwood Chips 144,000 100,000 Residues 148,450 95,850 TOTAL 389,600 421,700 Residues 148,450 Residues 95,850 Fuel2 23,981 Mulch2 39,241 Farm2 54,983 Fuel2 105,273 Mulch2 479,218 Farm2 82,722 Recovered Wood Fiber Const. Demolition Debris 32,858 Land Clearing Debris 15,430 Total 48,287 1 Fuelwood From Growing Stock Only 2 Includes Bark 5/28/2014 5:31:25 AM
Use of Maryland Timber* Hardwood Sawnwood 52% Softwood Sawnwood 18% Maryland Ind. Roundwood (Million Green Tons) Hardwood 1.5 67% Softwood 0.7 33% Softwood Pulp & Other 15.0% Hardwood Pulp & Other 15% *In and Out of State
Wood Fiber Processed in Maryland* Hardwood Sawnwood 38% Softwood Sawnwood 16% Wood Fiber Processed (Million Green Tons) Hardwood 2.3 68% Softwood 1.1 32% Softwood Pulp & Other 13.0% Hardwood Pulp & Other 32% *Including Fiber From Other States
Trends in Maryland’s Forest Industry • Manufacturing is not big part of Maryland economy – and has been declining • Manufacturing accounts for 6% of total employment • But wood-using industries important in some of Maryland’s most rural areas • Wood-using manufacturing accounts for 9% of manufacturing employment
Manufacturing as % of Total Employment USA – Right Scale MD – Left Scale Source: Maryland DLLR
Maryland’s Wood-Using Industry • In general, Maryland’s wood-using industry has fared about the same as the nation as a whole, but better than MD manufacturing in general • About 5,000 jobs depend directly on Maryland wood • Aboout 14,000 jobs rely on the forestry, wood and paper sector • Several mills have closed, but production has remained stable
MD Employment Trends Mfg. as % of Total Employment Forest Products as % of Total Mfg. Source: Maryland DLLR
MD Counties Where Forest Products are “Basic” Employment 37.7%
Factors Affecting Industry Expansion and Fiber Availability • Major trends affecting timber availability: • parcel fragmentation • increasingly passive management on state lands • changing owner preferences (non-timber objectives) • regulatory burdens • Lack of public awareness
Factors Affecting Industry Expansion and Fiber Availability • Major trends affecting timber availability: • Smaller tracts make logging more expensive, reduces returns to loggers, drives down stumpage prices, and reduces incentives for management
Back to the Question • What is the critical mass of forest land needed to support the wood-based manufacturing industry in Maryland? • Wood-based primary industry consumes about 3.3 million green tons of wood fiber, while producing 2.2 million tons • To support Maryland’s wood based manufacturingwould require the use of annual growth from 2.2 million acres • Only 1.7 million acres of available land (probably less), but not all growth being harvested, thus forests are advancing in age and stocking • To meet Maryland’s consumer needs requires 9.6 million acres each year • But self-sufficiency is not necessary
Back to the Question • What is the critical mass of forest land needed to support the wood-based manufacturing industry in Maryland? • Answer: no “threshold” to define critical mass. As parcel sizes decline, owner interest in management declines, management costs increase, revenue possibilities decline and commercial resource leaches away acre by acre • Wood fiber flow from other states likely to increase • Base for the remaining wood-based manufacturing economy is slipping away
Possible Strategies to Retain Working Forests and Viable Industry • Articulate goal of no net loss of commercial forestland • Undertake review of entire family of forest policies • Conservation Easements • Local Zoning Regulations • Further Property Tax Abatements (i.e. zero property tax) • Ensure working forest easements • Assess ownership fragmentation issue • Shortage of “intellectual capital” – more technical and educational assistance • Deeper subsidies • Improve outreach • Develop markets for low value wood (i.e. energy generation)