Analysis of DSRC Multi-Channel MAC Performance
330 likes | 815 Vues
Analysis of DSRC Multi-Channel MAC Performance. Gavin Holland, HRL Laboratories, LLC Fan Bai, Hariharan Krishnan, GM R&D. August 26, 2008. Purpose

Analysis of DSRC Multi-Channel MAC Performance
E N D
Presentation Transcript
Analysis of DSRC Multi-Channel MAC Performance Gavin Holland, HRL Laboratories, LLC Fan Bai, Hariharan Krishnan, GM R&D August 26, 2008
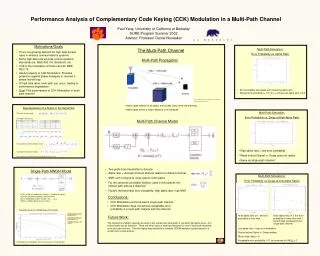
Purpose To evaluate and characterize the performance of DSRC’s multi-channel MAC coordination protocol (IEEE 1609.4 standard) for applications that depend on periodic, broadcast-based messages, such as cooperative collision warning (CCW) safety applications Objectives Analyze the impact of several design tradeoffs and parameter settings that have not yet been studied in-depth or on a large-scale, or are currently unspecified, for a plausible network configuration and scenario CCH/SCH dwell-time ratio CCH/SCH channel switching frequency Channel switching guard interval length Local clock synchronization error Methodology Realistic, large-scale simulation based on the HRL/GM WAVES simulation toolset Plausible network densities and traffic loading based on recommended defaults … MChan/MRate DSRC PHY BER/SNR/SNIR DSRC MAC … M-Chan Coord OBU/RSU DSRC Channel Emp Nakagami 2-Ray Pathloss … Standards Bodies IEEE SAE ASTM ISO … Vehicular Apps CMDD / TOLL SVA / CFCW Research Community Purpose and Objectives V2V Non-Safety V2V Safety Algorithms & Protocols DSRC Expert Analysis V2I Financial Orig. V2I FT App New V2I FT App RSU HRL “WAVES” Large-Scale Simulator
Conclusions and Recommendations Summary of Conclusions • The CCW packet success probability appears to decrease linearly with a decrease in CCH/SCH dwell-time ratio for a reasonably dense, plausible network configuration • However, queue occupancy suggests that a sharp decrease in performance could occur at ratios higher than expected due to problems with broadcast scheduling • A channel switching frequency of 20Hz (50ms equal dwell) appears to provide reasonable performance for CCW, due, in part, to reduced queue occupancies • The channel switching guard interval seems overly conservative in comparison to other radios, but the impact on performance does not seem to be as severe as presumed • Local clock synchronization error must be severe to be significantly detrimental • Overall, 1609.4 multi-channel switching appears to provide a feasible solution for simultaneous CCW and non-safety applications for the scenarios considered Suggested Changes to IEEE 1609.4 Standard • Provide a MAC layer management API/interface to enable upper-layer protocols and applications to register and receive MAC state changing events • Enables performance optimizing intelligent adaptation mechanisms based on explicit MAC monitoring and feedback • For example, CCW could adapt its transmissions to start/stop packet generation in (loose?) synchronization with the MAC’s switching on/off the CCH 2. Tighten the requirements on the channel-switching guard interval (i.e. 4ms) to improve system efficiency -- a detailed study should be conducted to see if system efficiency could be improved without significantly compromising synchronization
Presentation Roadmap • Executive Summary • Preliminaries • Analysis • Conclusions √
DSRC Multi-Channel MACCoordination Protocol OBU 1 OBU 2 OBU 1 OBU 2 RSU • Purpose of Multi-Channel Switching • Support different classes of applications (safety/non-safety) with different latency, range, and bandwidth requirements • Support different priority levels across and within applications, take advantage of channel diversity (Figs. 1 & 2) • Minimize contention between high-priority, safety-oriented control traffic (on Control Channel (CCH)) and non-safety application traffic (on Service Channels (SCH)) • Operation • Nodes are tightly synchronized, where a CCH interval MUST be scheduled at the beginning of every second (Fig. 3) • Time is divided into control channel (CCH) intervals and service channel (SCH) intervals (a “split-phase” approach) • OBU MUST periodically switch to CCH for safety, high-priority, and WAVE Service Announcements (WSA) packets • OBU MUST only use WSM packet format to transmit data packets on CCH (as a hedge against CCH congestion) • OBU MAY select service from WSA’s and switch to specified SCH provided by OBU/RSU • Guard Intervals are scheduled on entry to every interval to allow for differences in synchronization errors and switching delays RSU Fig 1. Channel Diversity for Increased Capacity Fig 2. DSRC Channel Allocation Fig 3. DSRC Multi-Channel Coordination Efficient multi-channel coordination is important for support of safety/non-safety application coexistence
Standard SCH Interval CCH Interval SCH Interval 150 100 250 (Activity) Schedule (Default) ? SCH Interval CCH Interval SCH Interval NAV ? Backoff Cancelled! 250 100 150 ? (Packet) Time (Now) Preempt! Save/Restore SCH Interval CCH Interval SCH Interval Schedule (Annex B) (Activity) SCH Interval CCH Interval SCH Interval Deferred NAV 250 100 Backoff Time (Now) (Packet) Assumptions Regarding Unspecified (or Loosely Defined) Protocols SCH Queue • Packet Scheduling • Standard requires cancellation of packet transmissions that do not complete at or before the end of the guard interval • Annex B suggests alternative approach, whereby packet is only transmitted if it is predicted to complete before end of interval • For our analysis, we use a similar approach, letting 802.11p decide if a packet can be transmitted in time • State Management • Standard does not define how MAC state (e.g. Backoff, NAV) should be handled across channel switches • For our analysis, we implement a state “freezing” protocol that stores the context of selected state parameters prior to switching away from the channel, and restores the context upon channel re-entry • Note, this assumes that the state of the channel is approximately the same across channel switches, which most likely is not the case for channels with small coherence time or very dynamic mobility, so care is taken to ensure that the context is relevant prior to restoration to limit the impact of “stale” state Fig 1. Packet Scheduling Fig 2. State Management Plausible packet scheduling and state management protocols were used in our analysis
Packet A B C D Broadcast Interval Time Vehicles Inter-reception Time Latency A Fig 1. Cooperative Collision Warning and Performance Metrics Illustrated B C D Application Model and Performance Metrics • Cooperative Collision Warning (CCW) • OBU periodically broadcasts vehicle status to neighbors (e.g. position, velocity, sensor status) on CCH • Neighbors use this information to infer collision likelihood and react accordingly • Assumptions • All vehicles have continuously backlogged SCH traffic and continuous access to service provider • Packet payload is 100 bytes, start of transmission staggered randomly between vehicles • Broadcast interval default = 100ms (but varied in some cases to observe impact of changes in load) • Performance Metrics (Network Metrics) Packet Success Probability (PSP): Prob(packet transmitted & received) Per-Packet Latency: Time received – Time transmitted • Performance Metrics (Application Metrics) Inter-Reception Time (IRT): Time received – Time last received Application-Level Reliability (ALR): Prob(IRT < tolerable time window “T”) Application model, assumptions, and metrics selected to represent and characterize a “challenging” scenario
Distance (meters) Vehicular, Radio, and Channel Models • Vehicular Models • Large Scale • 1920 vehicles on 8 lane 1.6km stretch of freeway, ~360 “neighbors” within 300m range • Eastbound lanes stationary (~5m apart), Westbound lanes moving at 25 mph (~10m apart) • Small Scale • 50 vehicles placed randomly in 2 x 0.5 km area, with no mobility • Used for illustrating phenomena and characteristics that don’t require large-scale scenario • Radio Model • Configured to match settings of DSRC-compatible radios • Receiver sensitivity = -95dBm • Noise factor = 5.0 • Antenna was 0dB omni at 1.2m high with 1.2dB of cable loss • Data rate = 6Mbps • Transmission power = 9dBm (300m effective range) • Channel Model • Fading model empirically derived from field test data • RSSI samples binned by distance and fit to Nakagami <m,Ω> • Common Friis/2-Ray used for Ω where samples insufficient • Simulated packet delivery ratio fits measurements well (Fig. 2) Fig 1. Large Scale Vehicular Model Fig 2. Measured and Simulated Packet Delivery Ratio Vehicular, radio, and channel models selected to approximate a plausible deployment scenario
Presentation Roadmap • Executive Summary • Preliminaries • Analysis • Conclusions √
Impact of Varying CCH Dwell Time Percentage Hard Constraints Sync Interval ..... ICCH + ISCH=ISync CCH Interval SCH Interval Guard Interval nxISync=1 sec, {n | nє} Start of UTC second Start of next UTC second CCH Dwell Time Percentage: (ICCH / Isync)x100% Impact on Applications? 25% CCH Dwell Performance Tradeoffs? Some Valid Configurations 75% CCH Dwell Reasonable Values? Background • The standard allows the CCH Interval (ICCH) and the SCH Interval (ISCH) to be different, just as long as the length of the Sync Interval (ISync = ICCH+ISCH) is a divisor of 1 second • Allowance has even been given for them to be dynamically adaptable in the future Issue • What impact does varying the ratio of CCH/SCH have on CCW performance? Approach • Set ISync=1secand measure impact of different ICCH and ISCH within specified constraints • CCW broadcast interval =100ms, and queues are large enough to hold ≈375 packets • Simulation scenario is congested freeway (1920 vehicles), confidence intervals are 95%
CCW Packet Success Probability Fig 2. Peak and Average Queue Occupancy Fig 1. Average Packet Success Probability Observations • Baseline result for 100% CCH dwell time (no switching) is shown for comparison • Intuitively, continuous SCH backlog results in proportional change in available CCH capacity with change in CCH dwell time percentage (Fig. 1) • Fig. 2 shows sharp increase in queue occupancy between 60%-40%, suggesting saturation of network • Interestingly, queue occupancy does not exceed maximum so decrease in PSP is not due to queue overflow What causes packet success probability to decrease with decreasing CCH dwell time percentage?
MAC Collision Avoidance and Error Recovery Fig 2. CW Growth During Error-Recovery Fig 1. Illustration of Basic Access Method for Scheduling Packet Transmissions Collision Avoidance • Before transmitting a frame, the node senses the busy status of the medium • If the medium is idle for at least a DIFS, the node may transmit its frame immediately • However, if the medium is busy, then the node invokes the “backoff” procedure to avoid a collision • Select a random integer BO over [0,CW], where CW is an integer in the range CWmin≤ CW ≤ CWmax (initially, CW = CWmin) • Compute a backoff time BT = BO x SlotTime, and set a timer that decrements BT for every idle slot following a DIFS/EIFS • When BT = 0, transmit the frame immediately Error Recovery • If it is detected that transmission of the frame failed, then the node invokes error recovery • Retransmit the frame after another backoff, but draw BT from the interval [0, CW = min(2 x CW + 1, CWmax)] • Repeat with increasing CW until the transmission succeeds, or the maximum number attempts is reached • There is no error recovery for broadcast or multicast frames because there is no mechanism to detect failure The lack of error recovery for MAC-level broadcast and multicast packets can cause significant problems
Issues with MAC-level Broadcast and Multicast EIFS Frame Defer Frame DIFS BTD = BTE Collision! Fig 1. Timeline Showing how Collision Occurs with the Current MAC Backoff Procedure Problem • Since there is no error recovery for broadcast or multicast frames, then CW does not increase (CW = CWmin) • Thus, the probability of collision is high when more than CWmin + 1 backlogged nodes attempt transmission • Since CWmin is small (7 or 15, depending on the version of the standard), then scalability is a serious problem • To illustrate, Fig. 1 shows a timeline for 5 nodes, where B-E queue broadcast frames when A is transmitting • Here, nodes C picks the smallest BT, followed by D and E, who select identical BT’s, followed by B • After A is done, C transmits next, then, since D and E have the same BT’s, they transmit simultaneously • Since D and E have no way of knowing that their transmissions collided, then their CW is unchanged • For A-C, even though they detected the collision and defer by an EIFS, their CW also does not increase Without error recovery, senders of broadcast and multicast frames cannot react to congestion-related losses
Channel Collisions due to Channel-Switching-Induced Broadcast Synchronization (CSIBS) SCHn Interval CCH Interval Packets Packets A A Time Time IP IP WSMP WSMP LLC LLC v red points show application-level packet transmissions v green points show when packet was transmitted by MAC v yellow points how when packets were dropped by MAC v blue points show RSSI of received packets MAC MAC Channel Switch ... ... SCH1 SCHn CCH SCH1 SCHn CCH PHY PHY Guard Interval SCHn CCH CCH Interval Fig 2. Illustration of source of collisions Fig 1. Profile showing collisions due to channel-switching-induced broadcast synchronization Problem • In DSRC, many nodes may have broadcast frames queued for one channel while tuned to another • Thus, upon entry to the channel all of the nodes attempt to transmit using BT computed using CW = CWmin • CWmin = 15 slots in 802.11 R2003, Section 15.3.2, and 7 slots in earlier revisions • Thus, there are large packet losses due to collisions at the beginning of the interval until queues are emptied • This is illustrated in Figs 1 & 2, which illustrate the problem for SCH/CCH switching and CCW applications • During SCH Interval, packets continue to be queued for the CCH by the CCW application • After switch to CCH, queued packets are transmitted in a burst with high probability of collision Collisions due to channel-switching-induced broadcast synchronization are the main cause of PSP decrease
Measured CCW Packet Inter-Reception Time and Application-Level Reliability Fig 1. Peak and Average Inter-Reception Time Fig 2. Measured Application-Level Reliability Observations • Peak and average IRT (Fig. 1) also increase with decrease in dwell %, as expected, with CSIBS causing sharp increase for CCH dwell < 40% • Note: even for the baseline case of CCH dwell = 100%, IRT > 100ms (the CCW broadcast interval) because the network load is sufficiently high that there are congestion losses even without channel switching • Fig. 2 shows the measured ALR for varying values of the application tolerance window T, computed using the average measured PSP and t = 100ms • Note: over all measured dwell times a tolerance window of T ≥ 2sec is sufficient for an ALR > 90%, and T ≥ 1sec is sufficient for an ALR of > 90% for dwell times ≥ 40% IRT and ALR values are reasonable for CCH dwell > 40% for the simulated CCW scenario
Impact of Varying Channel Switching Frequency Varying Channel Switching Frequency: vary ISync ISync= 50ms (20 Hz) Some Valid Configurations ISync= 100ms (10 Hz) Background • The standard allows the Sync Interval (ISync) to be varied (within aforementioned constraints) Issue • What impact does varying the channel switching frequency have on CCW performance? Approach • Set ICCH= ISCHand measure impact of different ISync within specified constraints • Two CCW broadcast intervals (t =100ms, and t =200ms), which indicates the different levels of network load, are used to observe impact of load • Simulation scenario is large-scale freeway (1920 vehicles), confidence intervals are 95%
CCW Packet Success Probability Fig 1. Average Packet Success Probability Observations • Baseline result of 0Hz (no switching) is provided as a basis for comparison, as before • For both broadcast intervals, there is ≈40% decrease in PSP between 0Hz and 5Hz, which is caused by CSIBS • For t =100ms, the PSP continues downward with increasing frequency, but only slightly so up to 50Hz • For t =200ms, the PSP first trends upwards with increasing frequency before it falls, owing to the fact that an increase in switching frequency decreases CSIBS by decreasing the chance that, within the same spatial region, there are sufficient vehicles with backlogged packets to cause collisions upon switching to the CCH Increasing channel switching frequency up to 50Hz does not appear to have a significant impact on PSP
CCW Packet Inter-Reception Time Fig 1. Peak and Average Inter-Reception Time for t = 100ms Fig 2. Peak and Average Inter-Reception Time for t = 200ms Observations • For both broadcast intervals, peak and average IRT is largely unaffected as the channel switching frequency is varied over the range of 5Hz to 50Hz. • For Fig. 1, this is seemingly counterintuitive since an increase in the switching frequency results in higher switching overhead and higher end-to-end packet latency. In fact, this is the case, but the IRT metric only considers the time between successive packets, which are relatively unchanged due to the high percentage of queued packets being transmitted close together at the beginning of a CCH. • The sharp trend upwards at 100Hz for both broadcast intervals is due to the inability of the MAC to schedule packets before the end of the interval, resulting in higher switching overhead due to channel idle time. Increasing channel switching frequency up to 50Hz also does not appear to have a significant impact on IRT
Guard Interval Overhead: vary length Sync Interval ..... Guard Interval CCH Interval SCH Interval Guard Interval Sync. Tolerance + Switching Delay Start of UTC second Impact of Guard Interval Overhead Background • An unavoidable overhead of channel switching in DSRC is the guard interval • The standard defines the guard interval to be the sum of the maximum synchronization tolerance and switching delay (4ms by default) • The synchronization tolerance is a function of the stability of the local clock, the availability of an external synchronization source, and the use of the TSF timestamp field protocol • The switching delay is the maximum time it takes a radio to switch between channels Issue • What impact does the size of the guard interval have on channel switching performance? Approach • Set ICCH= ISCHand vary ISync and guard interval to measure impact of guard interval overhead • CCW broadcast interval t =50ms, and CCH dwell time was varied from 5ms to 90ms • Simulation scenario is small-scale (50 vehicles), confidence intervals are 95%
Impact of Guard Interval Overhead on CCW Fig 1. Maximum available CCH capacity for two guard intervals Fig 2. Relative PSP for 4ms interval vs. no guard interval Observations • Fig. 1 shows the maximum available CCH capacity versus dwell time for a 4ms and 224us guard interval, where the latter is the guard interval for 802.11 FHSS radios (which we consider here to be a practical lower-bound). • Also shown in Fig. 1 is an estimate of the dwell time Ld at which the simulated load will saturate the network, which is based on the simple formula: Ld = Lg / (1 – l / c), where Lg is the guard interval,lis the simulated load, and cis the estimated CCH capacity (both in packets per ms) • Note that, for our simulated scenario, Ld ≈ 11.3ms, for a guard interval of 4ms, versus Ld ≈ 0.633ms for 224us • Fig. 2. shows the impact on the PSP, plotted as the ratio of with and without a 4ms guard interval. Notice that the relative PSP drops significantly near to the predicted saturation point. While the default guard interval is conservative, its impact on the PSP is minimal for reasonable dwell times
Synchronization Drift: vary local clock references Drift: -t Vehicle A Drift: +t Vehicle B Time Impact of Synchronization Drift Background • The standard allows for the coexistence of networks with and without external time sources • Although availability of an external time source (e.g. GPS) is assumed, it is not required Issue • How bad does synchronization drift have to be before performance is severely degraded? Approach • Set ICCH= ISCHand randomly drift local clocks in ± t usincrements every ms to measure impact of synchronization error • CCW broadcast interval t =100ms, and ISync=100ms (50ms CCH dwell time) • Simulation scenario is small-scale (50 vehicles), confidence intervals are 95%
Impact of Synchronization Drift on CCW Fig 2. Peak and Average Inter-Reception Time Fig 1. Average Packet Success Probability Observations • Here, we seek to only estimate how badly performance is impacted with varying degrees of synchronization drift. • Fig. 1 shows the PSP as a function of average clock drift, in us of drift per ms. Intuitively, PSP decreases with increasing drift as the probability that the sender and receiver are on the CCH at the same time decreases. • Interestingly, the trend appears to slow with larger intervals, which is due to the fact that as nodes become unsynchronized their CCH and SCH intervals overlap, reducing the impact of collisions due to CSIBS • However, the peak IRT does not share the same trend, and is worse than in the synchronized case shown earlier Synchronization error is a cause of concern, but it takes large drift to impact performance significantly
Presentation Roadmap • Executive Summary • Preliminaries • Analysis • Conclusions √
Recap of Conclusions and Recommendations Summary of Conclusions • The CCW packet success probability appears to decrease linearly with a decrease in CCH/SCH dwell-time ratio for a reasonably dense, plausible network configuration • However, queue occupancy suggests that a sharp decrease in performance could occur at ratios higher than expected due to problems with broadcast scheduling • A channel switching frequency of 20Hz (50ms equal dwell) appears to provide reasonable performance for CCW, due, in part, to reduced queue occupancies • The channel switching guard interval seems overly conservative in comparison to other radios, but the impact on performance does not seem to be as severe as presumed • Local clock synchronization error must be severe to be significantly detrimental • Overall, 1609.4 multi-channel switching appears to provide a feasible solution for simultaneous CCW and non-safety applications for the scenarios considered Suggested Changes to IEEE 1609.4 Standard • Provide a MAC layer management API/interface to enable upper-layer protocols and applications to register and receive MAC state changing events • Enables performance optimizing intelligent adaptation mechanisms based on explicit MAC monitoring and feedback • For example, CCW could adapt its transmissions to start/stop packet generation in (loose?) synchronization with the MAC’s switching on/off the CCH 2. Tighten the requirements on the channel-switching guard interval (i.e. 4ms) to improve system efficiency -- a detailed study should be conducted to see if system efficiency could be improved without significantly compromising synchronization
Questions? Thanks!
… … Results DSRC PHY BER/SNR/SNIR MChan/MRate DSRC MAC Core Models … Expert Analysis OBU/RSU M-Chan Coord Emp Nakagami 2-Ray Pathloss DSRC Channel Requirements … CORSIM Network TNO file Translation Binary Simulation TRD file Scripts Scripts Scripts Standards Bodies Scenario Repository Output Repository IEEE … … … SAE Error Files CFCW Expert Expert Expert ASTM SVA / EEBL Log Files Blocked Hwy TOLL Stat Files ISO Sample Stat File CMDD Trace Files … Sample Trace File Vehicular Apps SVA / CFCW CMDD / TOLL Research Community Sample Mobility File Sample Application File Wireless Access in Vehicular Environments Simulation (WAVES) Toolset Vehicular Application Scenario Generation WAVE Simulator Output Processing DSRC/Vehicular Models Vehicular Mobility Scenario Generation Engine QualNet Scenario Repository Flowing Hwy CORSIM Fwy CORSIM Urban Inters.
CCW Packet Inter-Reception Time CCH Dwell Time = 100% CCH Dwell Time = 20% Fig 1. Peak and Average Inter-Reception Time Observations • Peak and average IRT (Fig. 1) also increase with decrease in dwell %, as expected, with CSIBS causing sharp increase for CCH dwell < 40% • Note: even for baseline case of CCH dwell = 100%, IRT > 100ms (the CCW broadcast interval) because the network load is sufficiently high that there are congestion losses even without channel switching • This is illustrated in Fig. 2, which shows the samples sorted by IRT for 100% and 20% dwell times, and the characteristic “stair-step” pattern of the IRT with steps falling near multiples of the broadcast interval Fig 2. Samples Sorted According to IRT IRT is reasonable for CCH dwell > 40% for the simulated CCW scenario
CCW Application-Level Reliability Fig 2. Measured Application-Level Reliability Fig 1. Predicted Application-Level Reliability Observations • Fig. 1 shows the predicted ALR for varying values of the application tolerance window T, computed using the average measured PSP and t = 100ms • Fig. 2 shows the ALR computed directly from the simulation measurements • Overall, the predicted and measured ALR are in good agreement for T > 500ms, since the IRT is seldom larger than those values, and dependence on the dwell time is clearly evident • Also, note that over all measured dwell times a tolerance window of T ≥ 2sec is sufficient for an ALR > 90%, and T ≥ 1sec is sufficient for an ALR of > 90% for dwell times ≥ 40% Reasonable ALR values can be achieved for CCH dwell times ≥ 40% for the simulated CCW scenario
CCW Packet Success Probability (b) t = 200ms (a) t = 100ms Fig 2. Peak and Average Queue Occupancies Fig 1. Average Packet Success Probability Observations • Baseline result of 0Hz (no switching) is provided as a basis for comparison, as before • For both broadcast intervals, there is ≈40% decrease in PSP between 0Hz and 5Hz, which is caused by CSIBS • For t =100ms, the PSP continues downward with increasing frequency, but only slightly so up to 50Hz • For t =200ms, the PSP first trends upwards with increasing frequency before it falls, owing to the fact that an increase in switching frequency decreases CSIBS by decreasing the chance that, within the same spatial region, there are sufficient vehicles with backlogged packets to cause collisions upon switching to the CCH • The difference in backlogged packets is shown in the peak and average queue occupancies of Fig. 2. Increasing channel switching frequency up to 50Hz does not appear to have a significant impact on PSP
CCW Per-Packet Latency Fig 1. Average Per-Packet Latency for t = 100ms Fig 2. Average Per-Packet Latency for t = 200ms Observations • For the heavier load (t =100ms), the per-packet latency increases steadily with channel switching frequency • For the lighter load (t =200ms), the per-packet latency actually decreases as the channel switching frequency is varied over the range of 5Hz to 20Hz, and then is effectively unchanged until the sharp increase at 100Hz • This decrease mirrors the drop in the queue occupancies, resulting in a drop in the impact of CSIBS • The sharp trend upwards at 100Hz for both broadcast intervals is due to the inability of the MAC to schedule packets before the end of the interval, resulting in higher switching overhead due to channel idle time Increasing the channel switching frequency decreases the impact of CSIBS for the lightly loaded network
Demonstration of Decreased CSIBS with Increase in Channel Switching Frequency v red points show application-level packet transmissions v green points show when packet was transmitted by MAC v yellow points how when packets were dropped by MAC v blue points show RSSI of received packets Guard Interval CCH Interval Fig 1. Profile showing reduced number of collisions due to CSIBS when channel switching frequency is increased (100Hz) Observations • Increasing channel switching frequency results in decreased CSIBS because of lower queue occupancies • During SCH, fewer packets are queued for CCH resulting in smaller burst of packets and, subsequently, fewer collisions Impact of CSIBS can decrease with increase in channel switching frequency due to lower queue occupancy
Fig 1. Single participant Fig 2. Low density – 25% participation Fig 3. Medium density – 50% participation Fig 4. High density – 100% participation Application Reliability as a Function of Distance for Varying Tolerance Time Windows Impact on application reliability for all loads is significant for all but the largest tolerance window