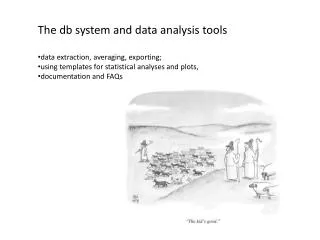
The db system and data analysis tools data extraction, averaging , exporting;
The db system and data analysis tools data extraction, averaging , exporting; using templates for statistical analyses and plots, documentation and FAQs. Data extraction. How do I get data from one or more instruments into a data file? Need to know what data you want!


The db system and data analysis tools data extraction, averaging , exporting;
E N D
Presentation Transcript
The db system and data analysis tools • data extraction, averaging, exporting; • using templates for statistical analyses and plots, • documentation and FAQs
Data extraction • How do I get data from one or more instruments into a data file? • Need to know what data you want! • (a) what instrument(s)? • (b) what averaging time? • (c) what processing (e.g., raw/edited)? • (d) what format? • How to figure out instrument names in the db system • data.instruments.getstn_id • station flow diagram • cpx2 • Data Records and Data Variables • http://www.esrl.noaa.gov/gmd/aero/software/aerosols/cpd2record.html • http://www.esrl.noaa.gov/gmd/aero/software/aerosols/cpd2variables.html • Types of archives • Raw, edited, clean, averaged
CPX2 might help you figure out what instruments are what… Tells you instrument ID, but not specific instrument…
Station flow diagram ftp://ftp.cmdl.noaa.gov/aerosol/doc/drawings/stn/
Best way to figure out what’s what! In a terminal window in Aer_vm, type: data.instruments.getstn Where stn is your station’s 3-letter id (e.g., mlo, app, cpr, etc.) A11 N71 S11 A12 S12 A13 2009Q4 | | | | 2010Q1 | | | | 2010Q2 | | | | 2010Q3 | | | | 2010Q4 | | | | 2011Q1 | | | | 2011Q2 | | | | | 2011Q3 | | | | | 2011Q4 | | | | | 2012Q1 | | | | | | 2012Q2 | | | | | | S11 2004-11-24T00:00:00Z TSI;3563;70417325: Installed N71 2004-11-24T00:00:00Z TSI;3022;608: Installed A11 2004-11-24T00:00:00Z Magee;Aethalometer-AE31;0202: Installed A12 2006-05-27T00:00:00Z RR;PSAP-3W;92: Installed S12 2011-04-10T00:00:00Z RR;M903;424: Installed A13 2012-03-30T18:05:07Z GMD;CLAP-3W;18: Installed Current Instruments: S11 TSI;3563;70417325 N71 TSI;3022;608 A11 Magee;Aethalometer-AE31;0202 A12 RR;PSAP-3W;92 S12 RR;M903;424 A13 GMD;CLAP-3W;18
Record names in cpd2 and the DB-system • Two-part naming convention • First part is instrument identifier ("S11") • Second part is record type • a high-frequency • m monitor (low-frequency, housekeeping) • r raw • Others… • Details at: http://www.esrl.noaa.gov/gmd/aero/software/aerosols/cpd2record.html Most common record type to extract Example: TSI Neph “S” records a High frequency. Scattering, backscattering, temperature, RH and pressure. m Low frequency. Status: voltages and reference. s Statewise. Flags and status string. c Zero results. Background k Spancheck results. So extracting “S11k” records would get nephelometer span check records
Variable names in cpd2 and the DB-system Number Conc. Optical property • Two part names • variable identifier • first letter is variable category (e.g., "B", "N", “Q") • various modifiers are used • wavelength, size cut, and more… • instrument identifier • first character is instrument category ("S") • second character is "line" identifier • third character is sequence number in "line“ • BsG0_S11 = optical property scattering, green wavelength, 10um, neph S11 • BbsR_S12 = optical property backscattering, red wavelength, neph S12 • Q_A11 = flow, absorption instrument A11 • details at: http://www.esrl.noaa.gov/gmd/aero/software/aerosols/cpd2variables.html Flow
Types of data in the db system raw - no corrections, no edits. Raw data exists as a physical archive. edited - edits and corrections, but has not (necessarily) been approved and put into the clean archive. Edited data does not exist as a physical archive clean - edits and corrections and has been approved by the station mentor. Clean data exists as a physical archive and is the source of most final data products. avg[HDM] averaged clean data, excluding records flagged as contaminated, with one record for each hour/day/month, with everything on line one split on cut size, and including standard deviations and counts for each variable. avgHe ,avgDe, avgMe As above, except from edited data instead of clean. how to get averaged data with corrections applied even if you haven’t had a chance to edit it yet…
Where can I find help? • Software webpages: • http://www.esrl.noaa.gov/gmd/aero/software/aerosols/ • (these webpages are also accessible under help menu on aer_vm) • Tutorial • ftp://ftp.cmdl.noaa.gov/aerosol/doc/software/ • How_to_Get_Data_Out_of_the_Aero_Database.pptx • FAQ • http://www.esrl.noaa.gov/gmd/aero/software/aerosols/dbfaq.htm
HOW TO: Extract data in Excel format • Constant format files 'xt2' creates files in comma-separated format with default name xt2 --header --clean -h cpr 2005 2006 • Makes a file called ‘al_HX.cpr’ in the current directory • AdvantagesDisadvantages • has neph, PSAP, CN data limited to neph, PSAP, CN • always has same format limited to min., H, D, M simple to remember can’t use other data base tools
HOW TO: Extract data in Excel format • New style "cpd2" formats Combine 'data.get' to select data with 'data.export' to get data file in desired format: data.getcpr S11a 2008:10 2008:11 |data.export --mode=excel > data.csv “pipe” db command db command record File name End time File format option Start time station • AdvantagesDisadvantages • data from any instrument complicated to remember • any averaging time format changes depending on instrument(s) • can use db tools and extraction modes
HOW TO: Extract data in Excel format – getting fancy Sometimes you want additional data in the file… Sometimes you want different format… db command records End time Start time pipe station data.getcprA11a,A12a 2008:10 5d clean | data.export --mode=excel --station=on --date-yeardoy=on > data.csv File name db command File format option Other file format options: http://www.esrl.noaa.gov/gmd/aero/software/aerosols/data.export.html Can choose header, missing value code, flag format, date format, delimiter.
Getting averaged data from db system Get data from hourly averaged archive Hourly averaged data is easy! • data.getmlo S11a,A11a 2008:10 2008:11 avgH| • data.export --mode=excel --station --date-fyear > data.csv How about 6h averages? Also easy! data.avg --interval=6h --source=edited app S11a 2011:1 3d | data.export --mode=excel > test_file Note: data.avg has other uses too: How do I get 1min data for just one size cut? A bit more complex… data.avg --interval=1m --stddev=off --count=off thd S11a 2010:1 1d raw | data.consolidate --source=- --regex --noautoavg '.+[^0]_.+' | data.export --mode=excel > test_file Alternatively, this will give you both size cuts but in different columns: data.avg --stdev=off --count=off --interval=0 thd S11a 2010:1 1d raw | data.export --mode=excel > test_file http://www.esrl.noaa.gov/gmd/aero/software/aerosols/data.avg.html
data.getcpr A11a,A12a,A13a 2012:116 1d avgHe | data.export --mode=excel > test_file DateTimeUTC,F1_A12,F1_A13,F2_A12,F2_A13,BaB0_A12,BaB0_A13,BaG0_A12,BaG0_A13,BaR0_A12,BaR0_A13,BaO0_A12,BaO0_A13,BaB1_A12,BaB1_A13,BaG1_A12,BaG1_A13,BaR1_A12,BaR1_A13,BaO1_A12,BaO1_A13,BaB0g_A12,BaB0g_A13,BaG0g_A12,BaG0g_A13,BaR0g_A12,BaR0g_A13,BaO0g_A12,BaO0g_A13,BaB1g_A12,BaB1g_A13,BaG1g_A12,BaG1g_A13,BaR1g_A12,BaR1g_A13,BaO1g_A12,BaO1g_A13,BaB0N_A12,BaB0N_A13,BaG0N_A12,BaG0N_A13,BaR0N_A12,BaR0N_A13,BaO0N_A12,BaO0N_A13,BaB1N_A12,BaB1N_A13,BaG1N_A12,BaG1N_A13,BaR1N_A12,BaR1N_A13,BaO1N_A12,BaO1N_A13,If1_A11,If2_A11,If3_A11,If4_A11,If5_A11,If6_A11,If7_A11,Ifz1_A11,Ifz2_A11,Ifz3_A11,Ifz4_A11,Ifz5_A11,Ifz6_A11,Ifz7_A11,Ip1_A11,Ip2_A11,Ip3_A11,Ip4_A11,Ip5_A11,Ip6_A11,Ip7_A11,Ipz1_A11,Ipz2_A11,Ipz3_A11,Ipz4_A11,Ipz5_A11,Ipz6_A11,Ipz7_A11,PCT_A11,Q_A11,X1c_A11,X2c_A11,X3c_A11,X4c_A11,X5c_A11,X6c_A11,X7c_A11,ZIr1_A11,ZIr2_A11,ZIr3_A11,ZIr4_A11,ZIr5_A11,ZIr6_A11,ZIr7_A11,Ff0_A12,Ff0_A13,Fn0_A13,IrB0_A12,IrB0_A13,IrG0_A12,IrG0_A13,IrR0_A12,IrR0_A13,L0_A12,L0_A13,Ff1_A12,Ff1_A13,Fn1_A13,IrB1_A12,IrB1_A13,IrG1_A12,IrG1_A13,IrR1_A12,IrR1_A13,L1_A12,L1_A13,If1g_A11,If2g_A11,If3g_A11,If4g_A11,If5g_A11,If6g_A11,If7g_A11,Ifz1g_A11,Ifz2g_A11,Ifz3g_A11,Ifz4g_A11,Ifz5g_A11,Ifz6g_A11,Ifz7g_A11,Ip1g_A11,Ip2g_A11,Ip3g_A11,Ip4g_A11,Ip5g_A11,Ip6g_A11,Ip7g_A11,Ipz1g_A11,Ipz2g_A11,Ipz3g_A11,Ipz4g_A11,Ipz5g_A11,Ipz6g_A11,Ipz7g_A11,PCTg_A11,Qg_A11,X1cg_A11,X2cg_A11,X3cg_A11,X4cg_A11,X5cg_A11,X6cg_A11,X7cg_A11,ZIr1g_A11,ZIr2g_A11,ZIr3g_A11,ZIr4g_A11,ZIr5g_A11,ZIr6g_A11,ZIr7g_A11,Ff0g_A12,Ff0g_A13,Fn0g_A13,IrB0g_A12,IrB0g_A13,IrG0g_A12,IrG0g_A13,IrR0g_A12,IrR0g_A13,L0g_A12,L0g_A13,Ff1g_A12,Ff1g_A13,Fn1g_A13,IrB1g_A12,IrB1g_A13,IrG1g_A12,IrG1g_A13,IrR1g_A12,IrR1g_A13,L1g_A12,L1g_A13,F2N_A12,F2N_A13,If1N_A11,If2N_A11,If3N_A11,If4N_A11,If5N_A11,If6N_A11,If7N_A11,Ifz1N_A11,Ifz2N_A11,Ifz3N_A11,Ifz4N_A11,Ifz5N_A11,Ifz6N_A11,Ifz7N_A11,Ip1N_A11,Ip2N_A11,Ip3N_A11,Ip4N_A11,Ip5N_A11,Ip6N_A11,Ip7N_A11,Ipz1N_A11,Ipz2N_A11,Ipz3N_A11,Ipz4N_A11,Ipz5N_A11,Ipz6N_A11,Ipz7N_A11,PCTN_A11,QN_A11,X1cN_A11,X2cN_A11,X3cN_A11,X4cN_A11,X5cN_A11,X6cN_A11,X7cN_A11,ZIr1N_A11,ZIr2N_A11,ZIr3N_A11,ZIr4N_A11,ZIr5N_A11,ZIr6N_A11,ZIr7N_A11,Ff0N_A12,Ff0N_A13,Fn0N_A13,IrB0N_A12,IrB0N_A13,IrG0N_A12,IrG0N_A13,IrR0N_A12,IrR0N_A13,L0N_A12,L0N_A13,F1N_A12,F1N_A13,Ff1N_A12,Ff1N_A13,Fn1N_A13,IrB1N_A12,IrB1N_A13,IrG1N_A12,IrG1N_A13,IrR1N_A12,IrR1N_A13,L1N_A12,L1N_A13
How do I get only absorption and not any of the crazy variables that I won’t look at anyway? data.consolidate --source=avgHcpr 115 116 'Ba*_A12' | data.export --mode=excel > myfile DateTimeUTC,BaB0_A12,BaG0_A12,BaR0_A12,BaO0_A12,BaB1_A12,BaG1_A12,BaR1_A12,BaO1_A12,BaB0g_A12,BaG0g_A12,BaR0g_A12,BaO0g_A12,BaB1g_A12,BaG1g_A12,BaR1g_A12,BaO1g_A12,BaB0N_A12,BaG0N_A12,BaR0N_A12,BaO0N_A12,BaB1N_A12,BaG1N_A12,BaR1N_A12,BaO1N_A12 POP-QUIZ! What does variable BaR0_A12 represent?? What about BaO0g_A12?
I don’t use excel…microsoft is the evil empire! data.getcpr A12a 115 116 avgHe | data.export --mode=idl > test_file JulianDay:0 Year:1 DOY:2 F1_A12_Bit0:3 F1_A12_Bit1:4 F1_A12_Bit2:5 F1_A12_Bit3:6 F1_A12_Bit4:7 F1_A12_Bit5:8 F1_A12_Bit6:9 F1_A12_Bit7:10 F1_A12_Bit8:11 F1_A12_Bit9:12 F1_A12_Bit10:13 F1_A12_Bit11:14 F1_A12_Bit12:15 F1_A12_Bit13:16 F1_A12_Bit14:17 F1_A12_Bit15:18F2_A12_Bit0:19 F2_A12_Bit1:20 F2_A12_Bit2:21 F2_A12_Bit3:22 F2_A12_Bit4:23 F2_A12_Bit5:24 F2_A12_Bit6:25 F2_A12_Bit7:26 F2_A12_Bit8:27F2_A12_Bit9:28 F2_A12_Bit10:29 F2_A12_Bit11:30 F2_A12_Bit12:31 F2_A12_Bit13:32 F2_A12_Bit14:33 F2_A12_Bit15:34 BaB0_A12:35 BaB0_A12_MVC:36BaG0_A12:37 BaG0_A12_MVC:38 BaR0_A12:39 BaR0_A12_MVC:40 BaO0_A12:41 BaO0_A12_MVC:42 BaB1_A12:43 BaB1_A12_MVC:44 BaG1_A12:45 BaG1_A12_MVC:46 BaR1_A12:47 BaR1_A12_MVC:48 BaO1_A12:49 BaO1_A12_MVC:50 BaB0g_A12:51 BaB0g_A12_MVC:52 BaG0g_A12:53 BaG0g_A12_MVC:54 BaR0g_A12:55 BaR0g_A12_MVC:56 BaO0g_A12:57 BaO0g_A12_MVC:58 BaB1g_A12:59 BaB1g_A12_MVC:60 BaG1g_A12:61 BaG1g_A12_MVC:62 BaR1g_A12:63 BaR1g_A12_MVC:64 BaO1g_A12:65 BaO1g_A12_MVC:66 BaB0N_A12:67 BaB0N_A12_MVC:68 BaG0N_A12:69 BaG0N_A12_MVC:70 BaR0N_A12:71 BaR0N_A12_MVC:72 BaO0N_A12:73 BaO0N_A12_MVC:74 BaB1N_A12:75 BaB1N_A12_MVC:76 BaG1N_A12:77 BaG1N_A12_MVC:78 BaR1N_A12:79 BaR1N_A12_MVC:80 BaO1N_A12:81 BaO1N_A12_MVC:82 Ff0_A12:83 Ff0_A12_MVC:84 IrB0_A12:85 IrB0_A12_MVC:86 IrG0_A12:87 IrG0_A12_MVC:88 IrR0_A12:89 IrR0_A12_MVC:90 L0_A12:91 L0_A12_MVC:92 Ff1_A12:93 Ff1_A12_MVC:94 IrB1_A12:95 IrB1_A12_MVC:96 IrG1_A12:97 IrG1_A12_MVC:98 IrR1_A12:99 IrR1_A12_MVC:100 L1_A12:101 L1_A12_MVC:102 Ff0g_A12:103 Ff0g_A12_MVC:104 IrB0g_A12:105 IrB0g_A12_MVC:106 IrG0g_A12:107 IrG0g_A12_MVC:108 IrR0g_A12:109 IrR0g_A12_MVC:110 L0g_A12:111 L0g_A12_MVC:112 Ff1g_A12:113 Ff1g_A12_MVC:114 IrB1g_A12:115 IrB1g_A12_MVC:116 IrG1g_A12:117 IrG1g_A12_MVC:118 IrR1g_A12:119 IrR1g_A12_MVC:120 L1g_A12:121 L1g_A12_MVC:122 F2N_A12:123 F2N_A12_MVC:124 Ff0N_A12:125 Ff0N_A12_MVC:126 IrB0N_A12:127 IrB0N_A12_MVC:128 IrG0N_A12:129 IrG0N_A12_MVC:130 IrR0N_A12:131 IrR0N_A12_MVC:132 L0N_A12:133 L0N_A12_MVC:134 F1N_A12:135 F1N_A12_MVC:136 Ff1N_A12:137 Ff1N_A12_MVC:138 IrB1N_A12:139 IrB1N_A12_MVC:140 IrG1N_A12:141 IrG1N_A12_MVC:142 IrR1N_A12:143 IrR1N_A12_MVC:144 L1N_A12:145 L1N_A12_MVC:146 Splits flags column into individual bits Tells you what columns data are in, file has no header
Intensive parameters – can I get those too? All those useful intensive parameters… single scattering albedo, Ångström exponent, etc. Do I really have to do the calculations myself? Nope…there’s a script for that! data.aggregate.intensivessgpXIs 2008:10 2008:11 XIs is the ‘short’ intensives record - mostly properties at 550 nm + blue/red Ångström exponent XIl is the ‘long’ intensives record – properties at all the wavelengths Go here to see specifically what is in the intensives record: http://www.esrl.noaa.gov/gmd/aero/software/aerosols/cpd2variables.html#intensives_record
I’ve made this data file – Now what? Move it from the AER_VM to your computer and do with it what you will… --excel --idl --matlab , igor, … --send it to someone… Another option: Use ‘R’ scripts on AER_VM to make several ‘canned’ statistical plots Scripts are in /aer/prg/r/ and /aer/prg/r/examples/ Some useful scripts are: density-plot.r multi-station-box-month.r quantile.r Note: the R scripts are set up to do the data extraction also – so you don’t need to extract data before using the scripts – you need to edit the script to tell it what data to extract...
This is what you type to run the script This is the stuff you can change to get the plot you want There is more stuff further down in the script that can be changed too.
Modifying the R script OLD NEW
Practical R stuff Opening the script to edit it on AER_VM use nedit or vi e.g., type: nedit multi-station-box-month.r <enter> The pound symbol “#” in an R script indicates a comment – the computer ignores everything on the same line after a ‘#’ Getting help with some basic R Get an ‘R’ book using the ‘R’ documentation online info: type: R <enter> at a command line prompt in a AER_VM terminal then type the name of the command you need help with for example type: ?POSIXlt <enter> at the prompt in the R interface to see stuff about time or type: ?read.csv<enter> to see stuff about reading files to get out of the R interface: type: q() <enter> Get a Derek (can’t have ours!)
Other scripts density-plot.r - generates xy-scatter plot showing relation between two variables and population density of points quantiles.r - outputs percentiles and median of a variable [1] "STN" "Variable" "0.01" "0.05" "0.1" "0.25" "0.5" "0.75" "0.9" "0.95" "0.99" [1] "bnd" "BsG0_S11" "21.177" "23.67" "28.75" "36.99" "48.25" "52.33" "54.56" "56.45" "59.14"
When you submit data to the WDCA, where does it go? Website: ebas.nilu.no Note: website is painfully slow. Need to be patient. - Public data Most of the data stored in EBAS are originating from programs encouraging an unlimited and open data policy for non-commercial use. For scientific purposes, access to these data is unlimited and provided without charge. By their use you accept that an offer of co-authorship will be made through personal contact with the data providers or owners whenever substantial use is made of their data. In all cases, an acknowledgement must be made to the data providers or owners and to the project name when these data are used within a publication. Public data are available without login.
How do I get data out of the WDCA? To get to this page need to click ‘accept terms’ on start-up page. Data policy is also here
Select group to get all parameters Select date range Download!
To get NOAA & NOAA collaborator data Pick country (USA, Canada, etc.) Pick station in country Pick sizecut (PM1, PM10)
Info/Caveats about data downloaded from NILU/EBAS There will be one file for each year, size cut, and instrument. If it’s NOAA collaborator file, the header will be huge and descriptive. The data files will have consistent format from year to year (so long as there wasn’t an instrument change). If you download data from a non-NOAA site the header may not be as informative. Non-NOAA station files may switch format from year to year. You will need to look in the header to see what data are in what column. Example list of TSI neph files for a station: PR0100C.20080101000000.20120201192555.aerosol_light_scattering_coefficient.pm10.1y.1h.lev2.nas PR0100C.20080101000000.20120201192555.aerosol_light_scattering_coefficient.pm1.1y.1h.lev2.nas PR0100C.20090101000000.20120201194805.aerosol_light_scattering_coefficient.pm10.1y.1h.lev2.nas PR0100C.20090101000000.20120201194805.aerosol_light_scattering_coefficient.pm1.1y.1h.lev2.nas PR0100C.20100101000000.20120202190241.aerosol_light_scattering_coefficient.pm10.1y.1h.lev2.nas PR0100C.20100101000000.20120202190241.aerosol_light_scattering_coefficient.pm1.1y.1h.lev2.nas PR0100C.20110101000000.20120201160604.aerosol_light_scattering_coefficient.pm10.1y.1h.lev2.nas PR0100C.20110101000000.20120201160604.aerosol_light_scattering_coefficient.pm1.1y.1h.lev2.nas